I wanted to talk a bit about the sequester and its impact on the markets from a trading perspective. Before we get into the sequester itself, let’s take a look at volume and discuss some of our thresholds.
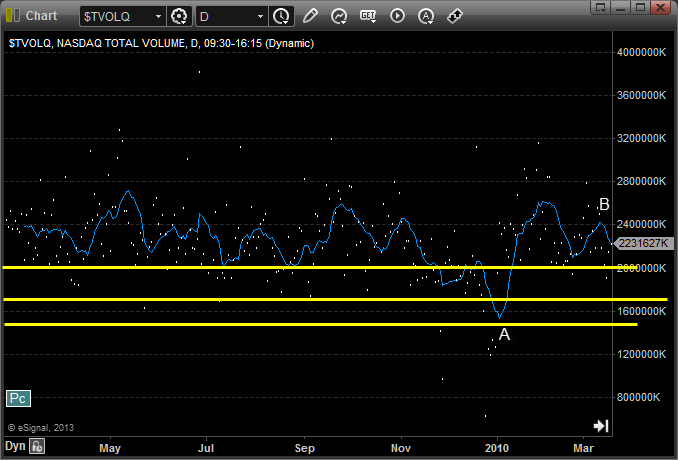
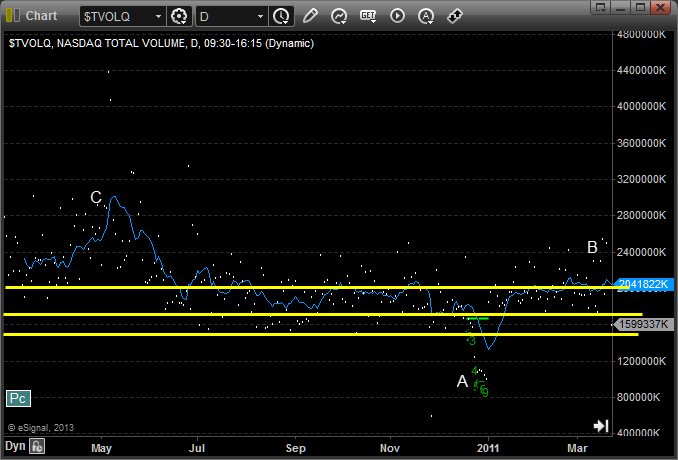
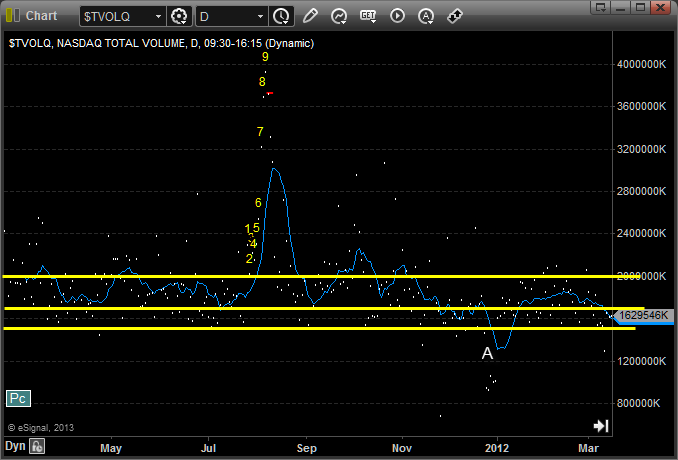
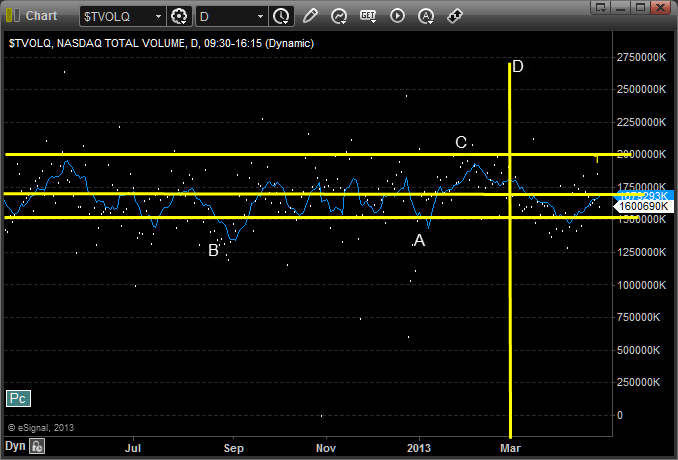
First of all, here’s volume from April 2009 to April 2010. Each of these charts is going to show the daily NASDAQ volume, with a 10-day moving average of that volume, and three horizontal lines. One will be drawn at 2 billion shares, which is really when you have a great trading environment. One will be drawn at 1.7 billion shares, which I consider to be the minimum need for a decent day or set of days. And the final one will be drawn at 1.5 billion shares.
So, here’s April 2009 to April 2010:

A couple of notes on that chart above. First of all, every year, volume drops off sharply in the week between Christmas and New Year’s to close out the year (point A), so that dip in the moving average of volume doesn’t concern me. You’ll notice that most of the year, like the 12 years prior to it, volume was above 2 billion shares (the moving average even appears to use that as support). And you’ll notice that the March/April area under point B isn’t exactly a point that volume dips, even though people do have Spring Breaks and such around that time.
Let’s look now at April 2010 to April 2011:

What’s different here? Not a ton. On average, volume was a little less, with the moving average spending more time between 1.7 billion and 2 billion shares, but we still had plenty of days over 2 billion. We had the end of year slip at A that doesn’t matter. Volume was still up in March and April under B. And we can even see that the best part of the year volume-wise was back at C in May and June. Good enough.
April 2011 to April 2012:

More of the same there, really. We’ve spent most of our time between 1.7 and 2 billion shares on average. We had plenty of days over 2 billion. The big volume was the dip in the markets in August, so we really didn’t even see the usual summer slowdown (volume can dip in August). End of the year at A, again, doesn’t matter. Good enough.
Finally, we look at the last 12 months, from April 2012 to April 2013:

Hmmm. This seems different. The whole scale is different on the right because there are many more days down near 1.3 billion, and few above 2 billion. The closest that the moving average came to 2 billion shares was in February. We can again ignore the dip at A for end of year, but look how low things got in August at B. Granted, it’s August, it can dip, but that was bad. So the overall shift here is much lower volume, very few good volume days, and look at the current move. In MARCH, the moving average dipped under 1.5 billion for a bit? This is an odd time of year for that sort of drop. We did rise the last two weeks, but we’ve had earnings season to create a little volume day to day. What happens now that that is over.
The highest point in the moving average of volume in the last year was under point C in February. And, I’ve drawn a vertical line D. What is that? That’s the sequester kicking in.
Charts don’t lie, people do. If you’re going to take the above four charts and try to convince yourself that the sequester isn’t the reason for the current state of volume and action in the markets, there is no need to read further. Facts don’t seem to matter to you.
Now let’s pivot and look at the last year on the S&P 500 index:

I’ve drawn two uptrend lines. We talk all the time about the fact that when a trendline breaks, you want to see it break, retest, and then fail, and that’s your actual break. Until all of that happens, you don’t have a break. So let’s look at the first line, which was the rally from June of last year until October. We created this line off about 5 points, and then we broke it at A, retested it at B, failed, and the rollover from there was the drop, although it didn’t last long. We then, from mid-November, created a new uptrend line off of three or four points. We broke it just over a week ago at D, but we rallied back above it. No failed retest so far. The uptrend continues, sort of. But, as we know, without volume.
Point C on the chart is the end of 2012, and you’ll notice that the first two days of the year, the market leapt higher as the government “solved” the fiscal cliff, which had been a big concern the second half of 2012. This is what had held volume back. There was too much uncertainty about tax rates and spending and more. The market doesn’t like uncertainty. It may not sell-off on it, but it makes it harder for people to commit.
I kept getting asked late in the year why the market wasn’t selling off ahead of the fiscal cliff, and I didn’t really expect it to. Here’s why: the market assumes that no matter how stupid the folks in Washington DC are, they aren’t dumb enough to let us go over the cliff. Will they take care of it sooner rather than later? No, because live in the world of Prisoner’s Dilemma anymore, and he who blinks first has to give a little. We run this country now by government by crisis. Create a crisis, take it to the end, and get the most that you can for your side. It is, honestly, not a way to run a country. Two sides can disagree. You come together in the middle for the good of the country. That’s how it has always been done.
One of the negatives though was that even though they solved the Fiscal Cliff, giving the market some certainty, they didn’t really solve the budget issues for years to come. They pushed off the sequester for a few months to try to get a solution in place.
If you go back to the chart of volume of the last year, I pointed out that the highest point of volume on the chart was in February of this year. So in other words, once the Fiscal Cliff was behind us, volume picked up. The markets also took the events of the Fiscal Cliff and felt secure that the same would happen: at the last minute or just after, Washington would figure out the sequester and not do anything stupid. That’s just how it works.
The problem is, so far, they haven’t figured it out, and volume has dropped off a cliff again because the markets are now uncertain about a lot of things.
I realize some people will say “Well, I don’t mind cuts in Defense, we got bloated there anyway since our Defense Budget is now the size of the next 13 biggest countries in the world (all of whom are our allies).” And others will say “I don’t mind cuts in domestic spending because government is bad and too big.”
Fair enough. But the sequester hits everything equally as a percentage with no regard for what matters. If you really want to balance the budget, isn’t there a process where we figure out what PARTS of defense could be cut and what domestic programs we don’t need and then bridge the gap on revenue but slashing loopholes a bit for junk that only the elite are using? Or, Heaven forbid, redo the tax code in the process to make it simpler to figure out with less loopholes for the top while lowering rates. But, all of that means both sides moving a bit.
So why is the market so uncertain just because of the sequester?
Well, first of all, in bad economic times, austerity only raises unemployment. Just take a look at Europe (26% in Spain!). I’m never clear how people don’t understand that when spending slows down, people are put out of work. The government and the Pentagon in particular went out of their way late last year to slow some non-personnel spending, hoping to be able to live through a few months of the sequester if needed, but you can’t around the fact that as the sequester drags on, it means people out of work. Higher unemployment. Less money to spend. But it is worse than that, because the market doesn’t know what to do here. Friday’s GDP number for Q1 came in under the expected number, clearly indicating that the economy is slowing again because of this, just as things were starting to get better.
But we can point to other ways that this is having a big impact. The Federal government spends a lot of money each year on scientific research. We know that on average, scientific spending gets about a 60 to 1 ROI (Return on Investment). For example, all of the spending done on mapping the human genome got about a 160 to 1 return. So in other words, if you spend $1 billion on that, you get $160 billion back in economic growth in the years after. Obviously, some scientific spending gets you no results, but ON AVERAGE, it’s 60 to 1. Because of the sequester, if it doesn’t end, we will be cutting around $50 billion out of scientific spending before the end of Fiscal 2013. Take that times 60, and you’ve lost $3 trillion in GDP in the years ahead. This is a BIG DEAL.
Right now, the market is still assuming that something will change. We’re all hoping that the solution is long-term, and not just a band-aid that lasts six months or so. The more certainty you give on this, in terms of a path for years ahead, the faster and better the economy will grow, but also the faster the markets will react. People will get back to it. No one wants to be collecting stocks here if the sequester doesn’t end. It WILL lead to a slowdown in the economy, higher unemployment, and make the US GDP growth down the road less competitive. But, the market still assumes that Washington will do what they have been doing, which is at least band-aid it, if not finally fix it, before they have taken the hostage situation too far. And that’s why the market doesn’t know if it should break the uptrend, and that’s why volume is down, which, more than anything, is not what we as traders like, because it makes things behave less technically (have you traded the futures lately?).
I always say that I don’t need or expect 5 great trading days per week with great volume. Two or three is good enough. Measure the volume, and you know which days are light, and you can try less or even not really trade those days. But we’re now living in a new reality. Just as things started to improve after the fiscal cliff ended, they’ve gotten much worse due to the sequester. From an active trader’s perspective, this is the first thing in years that is having a lasting impact on equity market trading.
