Forex Calls Recap for 1/21/14
A loser and a winner that is still going for the session. See GBPUSD section below.
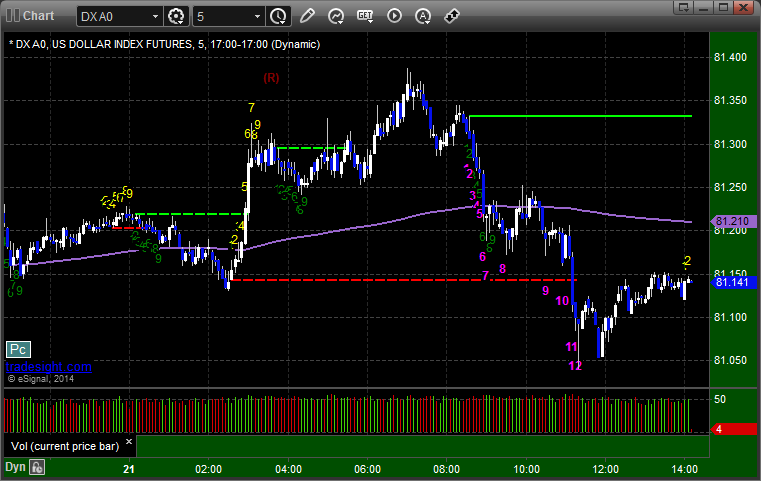
Here's a look at the US Dollar Index intraday with our market directional lines:
GBPUSD:
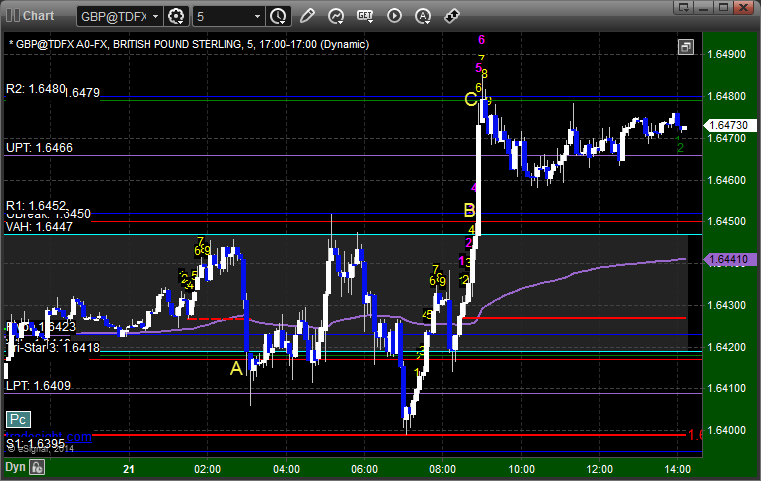
Triggered short at A and stopped. Triggered long at B, hit first target at C, still holding second half:
2013 Market Recap and 2014 Preview
Every year, we wrap the year with a summary of what the markets did for the year and a general discussion of our results. If you'll recall, in the report at the end of 2012 leading into 2013, we had just averted the Fiscal Cliff although the extension to the debt ceiling had only been two months. My expectation was that market volume would pick up, stocks would remain solid and maybe even get better from a trading perspective, Forex would definitely improve, and futures might see better action as well if volumes picked up. Two out of three isn't bad.
We had a tremendous year once again trading stocks, although we will talk in a bit about what a ridiculous year it was for the stock market. Usually, we rely on making money on both the upside and downside of the markets, and 2013 was a year that was only about the long side. Forex did improve a bit in terms of ranges. The problem remained futures, as volume in the stock market dipped to the worst in 15 years.
In the end, we had a terrific year of Forex results even though we dropped to half size in August and never raised it back up because the ranges didn't return. We ended up with 11 out of 12 months profitable in Forex and almost 1900 pips of net gains. Futures had two poor months early that hurt the net results for the year. Our methods for stock trading continued to work well, and we ended up winning 67% of our stock calls that triggered with market directional support. That's a pretty nice result.
Let's start first with the topic of market volume. Here is NASDAQ volume daily in 2013 with a 10 day moving average:
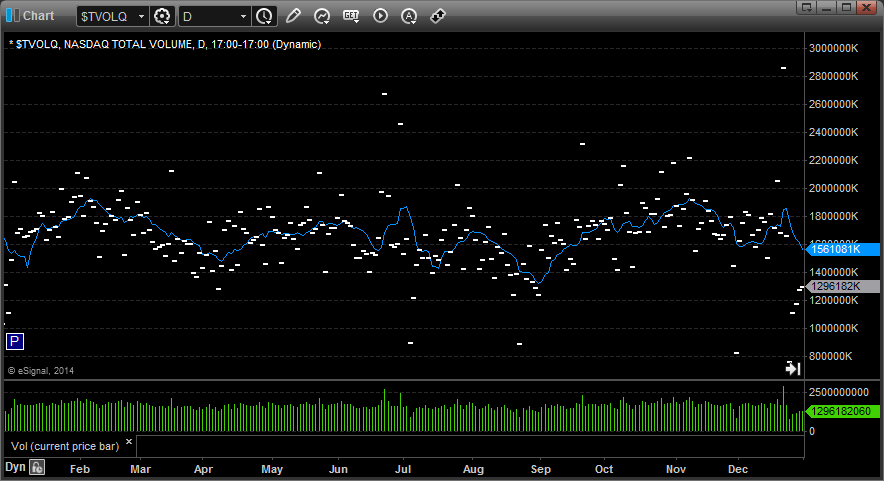
As you can see, we never had a point where the 10 day volume average came near 2 billion shares, and I would say that the average for the year was 1.7 or less. We had the usual dip in August for summer vacations, although this dipped more than usual, and we had a really weak last two weeks instead of just one because the Holidays were on Wednesdays.
Still, if you compare it to 2012, where the average was up closer to 1.8 billion shares even if the moving average never got over 2 billion, and 2013 is the worst volume year in a long time:
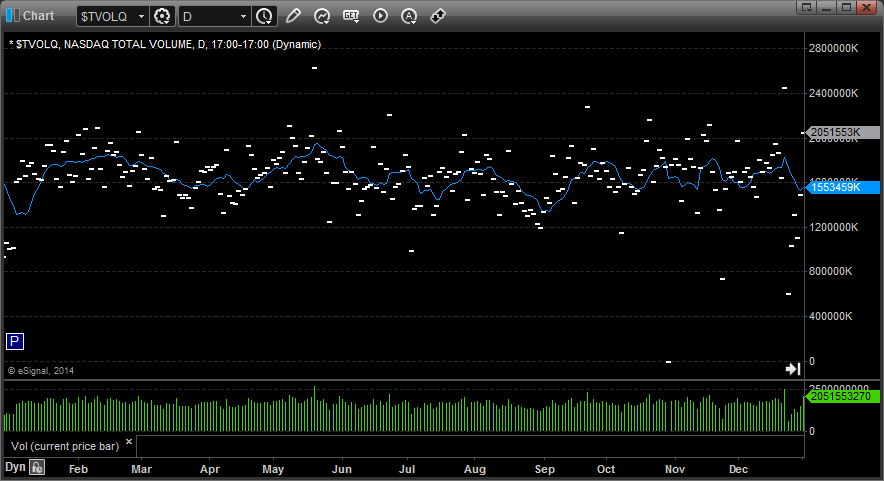
For the record, we should also look at 2011, where the average spent most of the year over 2 billion:
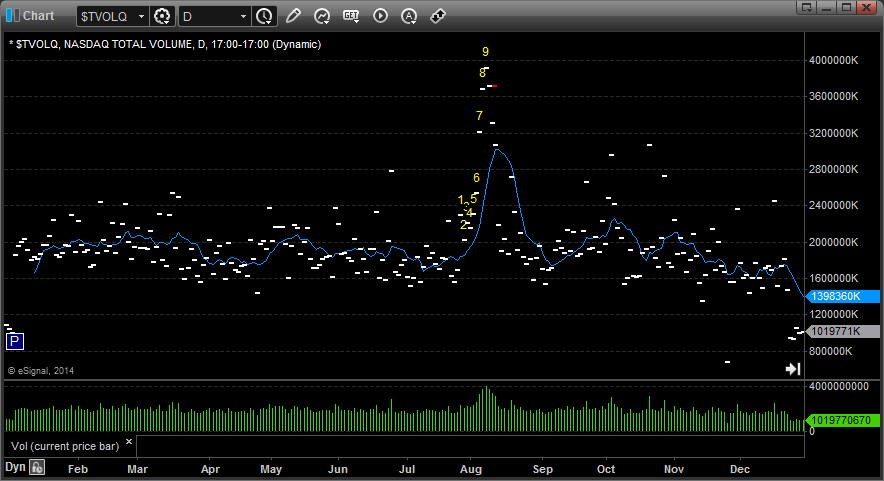
Without volume, trading the futures is a much tougher business. There are still plenty of stocks moving on any given day because there are thousands of stocks to scan and choose from, but the ranges on the futures dipped, and there were a lot of days where we didn't see the volatility in the first hour or so that we usually do.
Let's move on and discuss the indices, because this is where 2013 is so strange. Despite all of the issues in Washington and the lack of volume, the markets kept chugging along and put in one of their best years on record. The S&P closed 2012 at 1426.19 and closed 2013 at 1848.36, a gain of 422.17 points or 29.6%. Here's the chart:
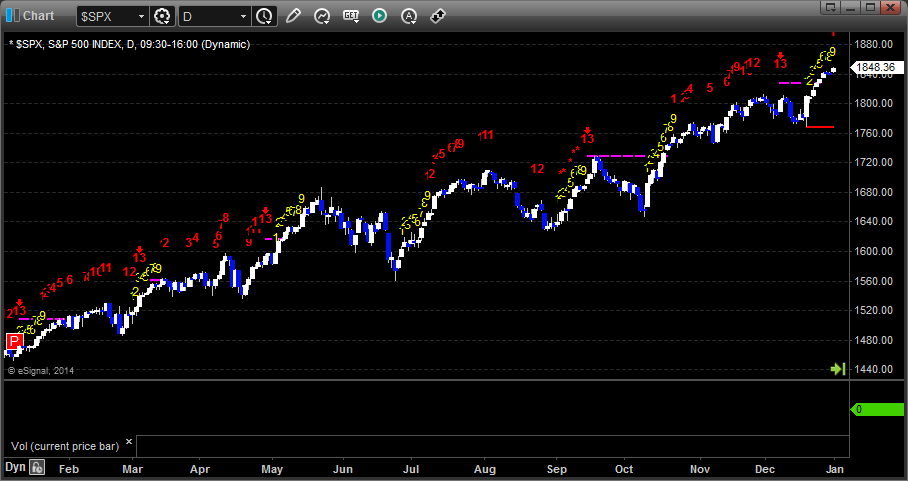
Note that even though we did get a couple of brief pullbacks in June and August (when there was even less volume), the S&P shrugged off 4 separate Seeker 13 sell signals and NEVER EVEN HAD A SINGLE 9-BAR START-UP PHASE to the downside. That is remarkable.
The same is basically true of the NDX 100, the NASDAQ index, which also shrugged off 4 separate Seeker 13 sell signals without a downward start-up. NDX closed 2012 at 2660.93 and closed 2013 at 3592 exactly, up 931.07 points or 34.9%:
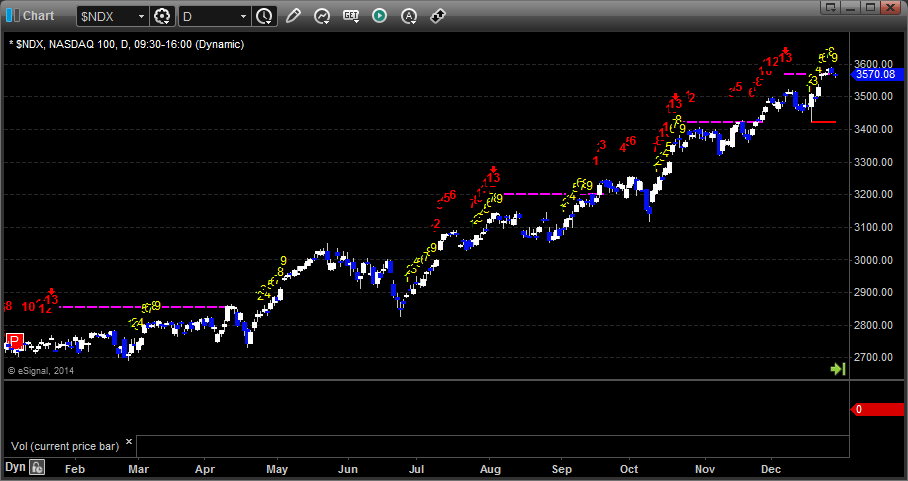
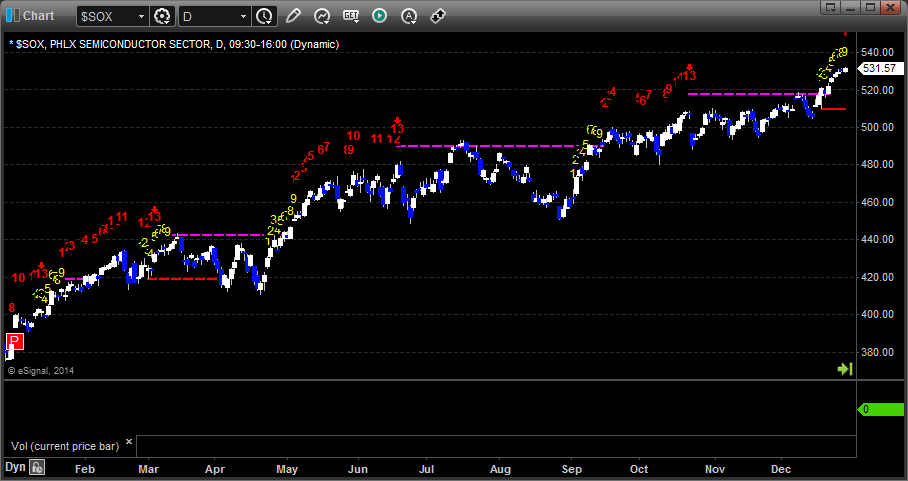
To look at two of the other sub-sectors that we follow closely, the SOX (Semiconductor Index) had a solid year:
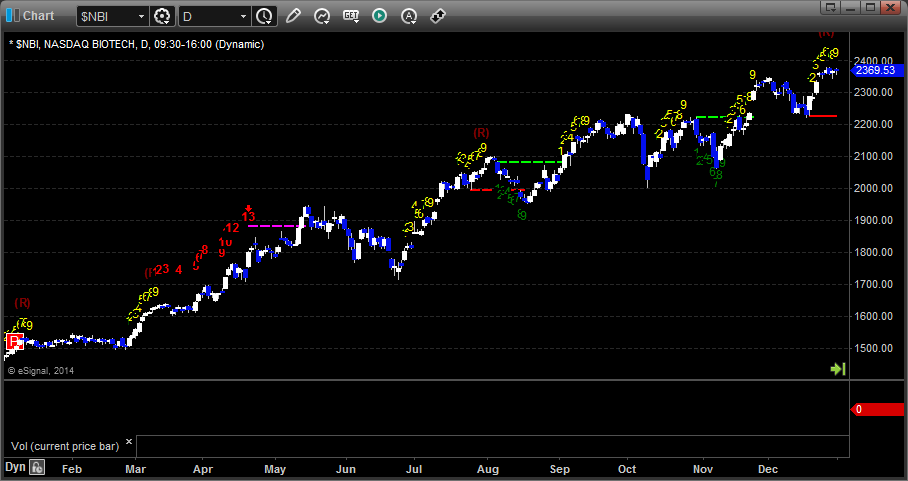
As did the Biotechs (NBI), which were up 65%, but did have several 9 bar START-UP phases to the downside, each of which was a short term low along the way:
Usually when I do these end of year summaries, I have a lot of trend lines to draw to show where various up and down trends ended back and forth. There is none of that to do this year when it comes to the major equity indices. The back two months of the year, as I kept saying OVER and OVER at the time, was almost destined to close higher because stocks were up so much for the year and no one wanted to sell and lock in the trading gains and have to pay taxes for the year. Without sellers, those stocks tend to push higher in the last month or two of the year, which is exactly what happened, and we closed out near the highs.
Let's look at some of the individual stocks that we traded over and over (our popular traders) and then we will put the current location of the market in a broader context, and then we will discuss Forex a bit.
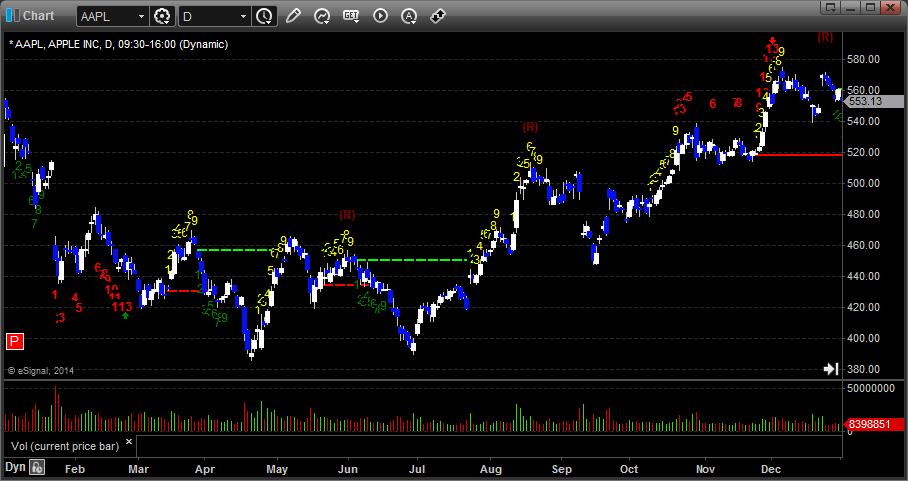
AAPL is historically one of the stocks that we trade a lot. It came into the year in the middle of a sharp sell-off from 2012 that we had called. Our targets had been $420 and then $370. 420 hit, and I still think 370 will be a target someday. In the end, the stock rallied in the second half of the year enough to come back and close just barely green for the year (conveniently, so AAPL can continue to show positive results for investors year over year. Note that there was only 1 Seeker buy signal and 1 Seeker sell signal for the year:
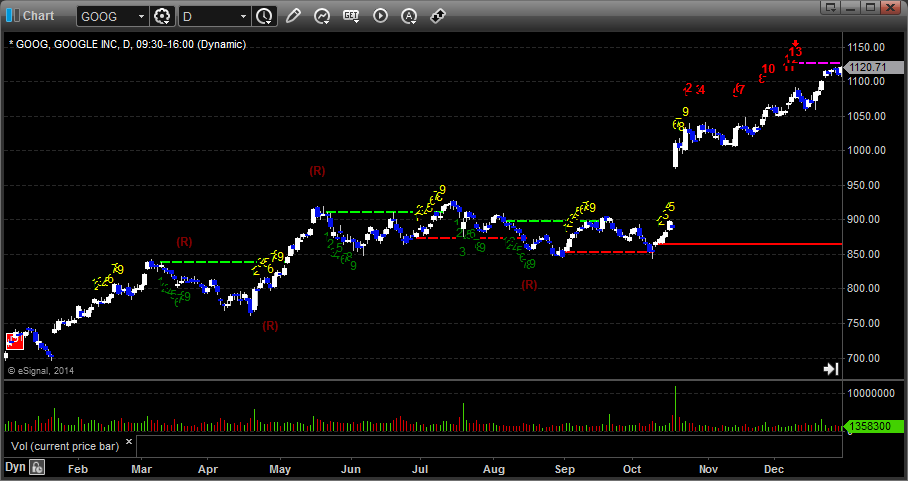
Meanwhile, where AAPL loses, GOOG gains, and GOOG had a remarkable run for the year. There was little chance people would be selling this stock late in the year, and it closed at highs. Note that with that, there was only 1 Seeker signal for the year, and it was a sell during the Holidays in December after the big run:
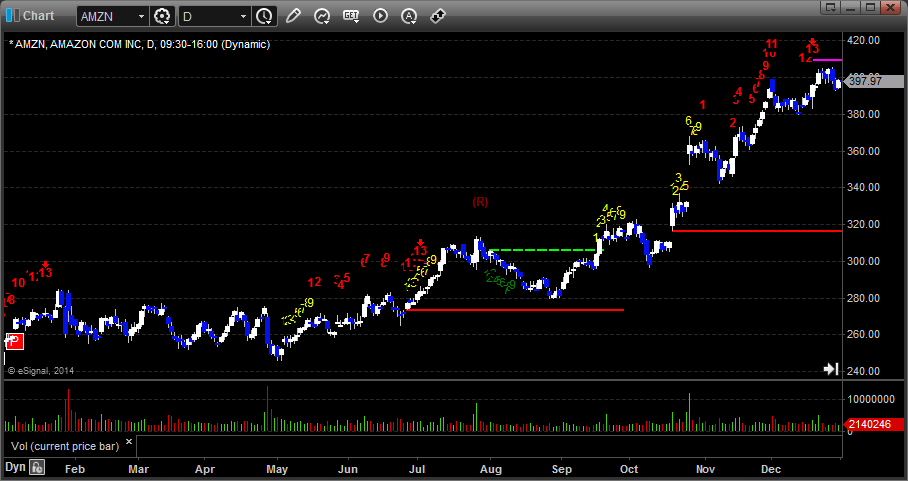
AMZN was another big winner, and another great example of how stocks that are up for the year tend to run even harder in November and December:
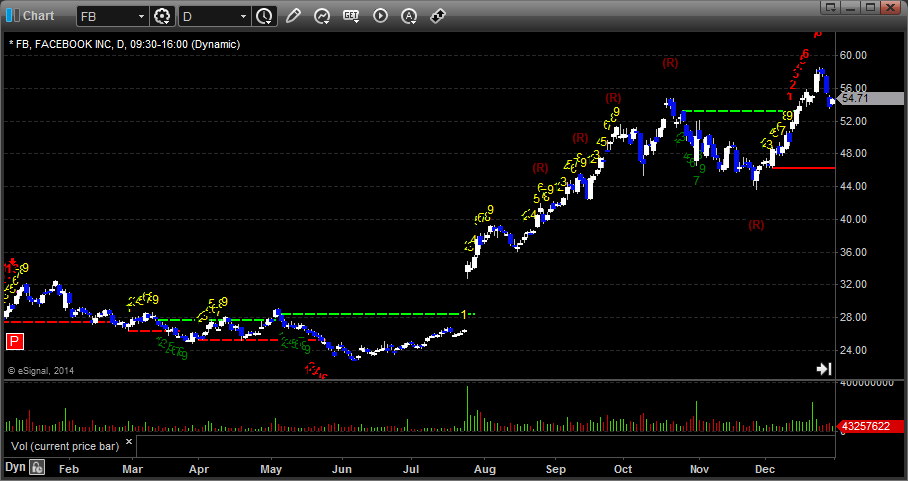
Facebook (FB), which was a debacle coming public in 2012 and trapped a lot of money that usually would be trading in the markets, finally got back to its IPO price at $42 and then launched higher (again, no sellers once it hit prices that no one owned it at). Note that market action and volume improved as people were able to get that money out of FB, and I had commented last year that FB's IPO itself played a big role in total market volume dropping, so that is really an important point to note. There were NO SEEKER signals either way the whole year on FB:
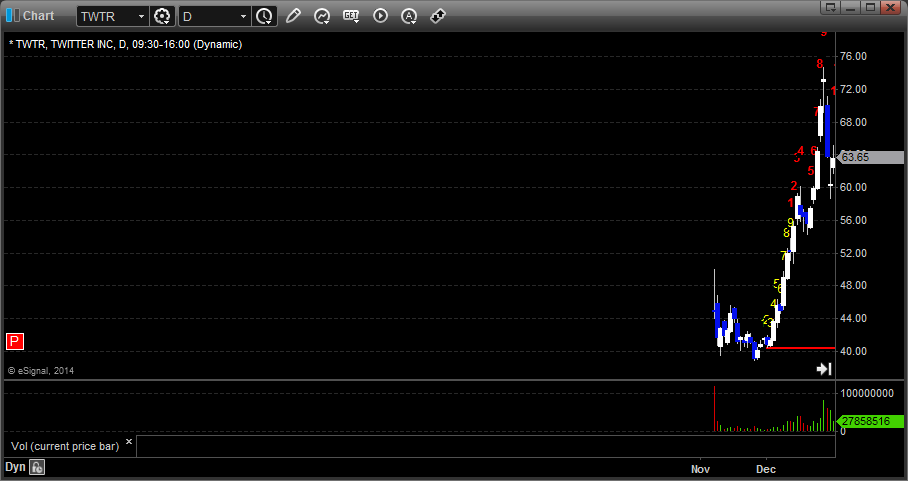
If there was a new stock on the block that could have been a problem like FB was in 2012, it was Twitter (TWTR), which came public late in the year at $26 a share but opened in the 40's and actually stayed there. Once again, though, here is even a better example of how the tax selling issue works. Here is a stock that no one owned over $26 when it came public. Anyone that jumped in in the 40's early may have not seen an results, but again, if most people own the stock at 26 and it has only traded up 50% or more from that, who wants to sell and lock in that level of gain? And in fact, with the stock so new, many types of shares can't be sold. This combination leads to a big squeeze in the last days of the year when the sellers dry up completely and there are no shares available to short. Some might confuse this as being a function of the value of TWTR, but it is not. Don't be surprised if this is the high in TWTR for a while:
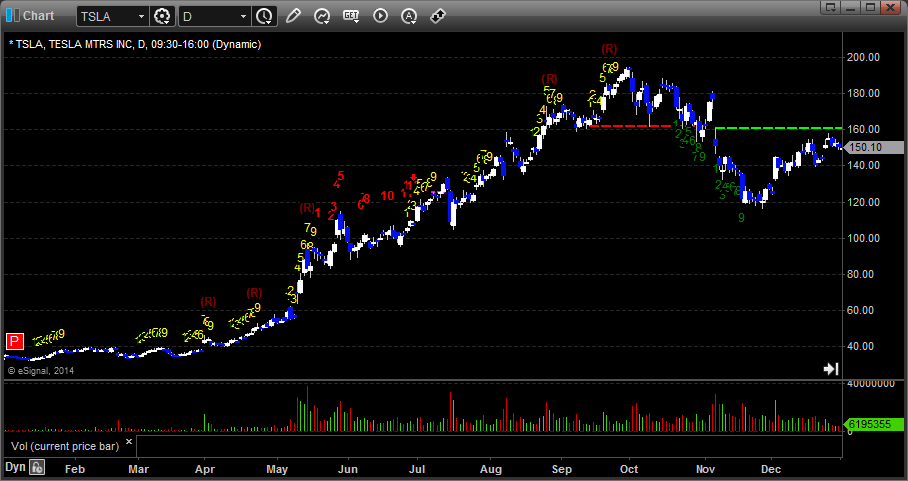
TSLA also had a great year, moving from under 40 to almost 200, and even though it gapped down a bit on the last earnings report of the year, it is still a solid return for investors and one that no one was in a rush to lock in during November and December:
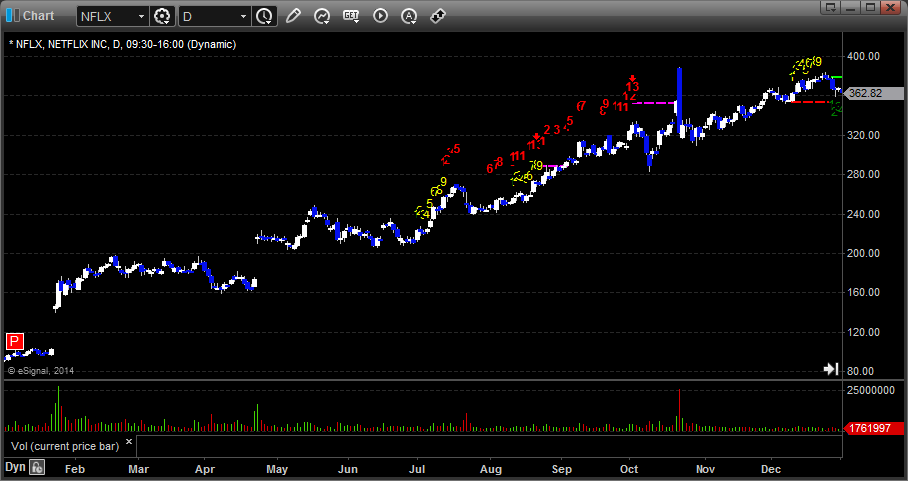
Another that we traded frequently was NFLX which had a solid year in general:
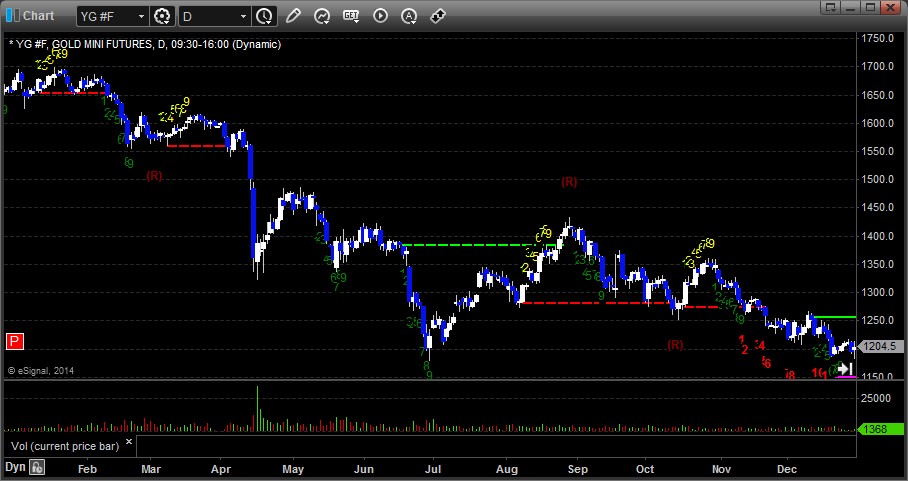
I should also note that money continued to move out of Gold, which also probably helped push the stock market. Note the Seeker 13 buy signal late in the year that has so far been a floor:
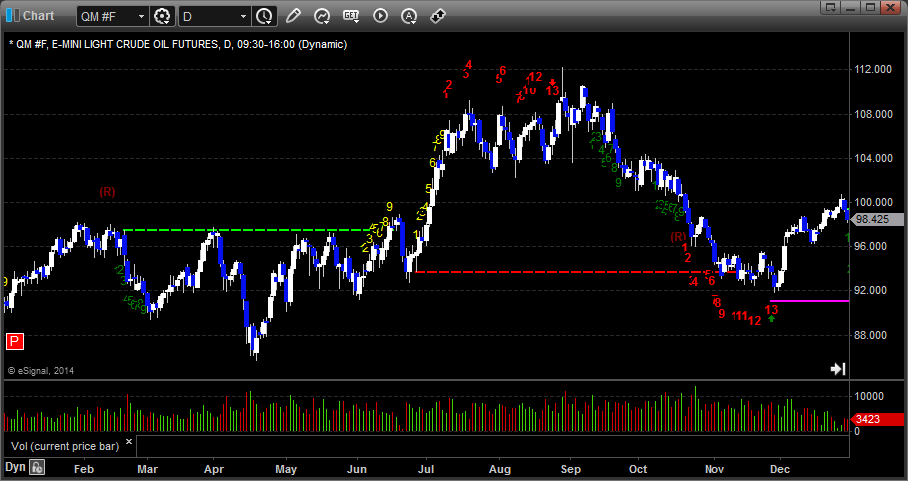
And also we need to do our annual check of crude oil, which actually spent most of the year between 85 and 98, although it did have that beautiful breakout in July that pushed it up to $112 during the usual hot part of the year (and Hurricane season). Note that there was a Seeker sell signal at the high and a Seeker buy signal at the November low:
So where does this put us in the broader context of the S&P 500 and NDX indices? Well, it's quite interesting in general.
Here is the S&P 500 monthly chart going back to 1996 or so:
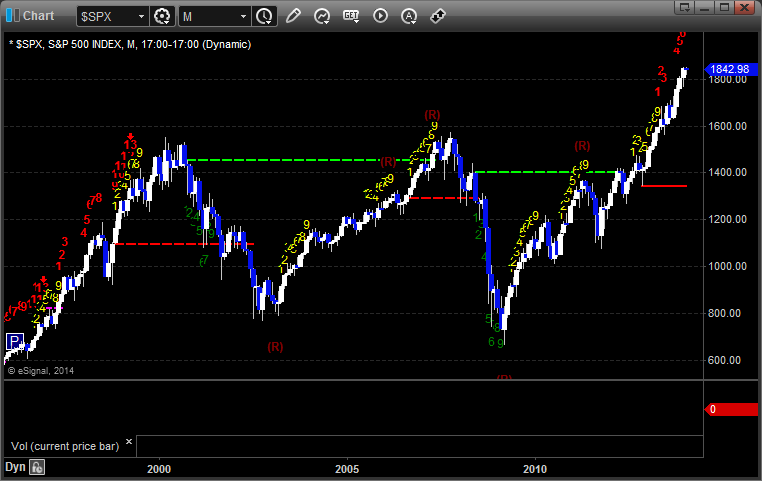
The first drop is obviously the bursting of the Y2K/Internet bubble that took the market from 1500 as we came into the decade to a low of 800 or so in 2003. We then rallied off of that for about 4 years, making it just back to the highs, and then rolled. We called that drop from the point that oil first broke above $80 a barrel back in 2007, and that led to a crumbling of the market at a record pace and the banking collapse of 2008. The low of the market hit in March 2009 as the stimulus started to take hold, and the market has now officially broken out, aided by QE3 as some would say, and running. Unemployment remains a problem in real terms, but that should not be confused with the growth rate of the economy. We still need to get people back to work to complete the repairs, as some might say, but we also shouldn't confuse the fact that technologically and with outsourcing of many labor factors to other countries, we may not get back to a point of full employment again. While that doesn't help the people in the bottom 20%, it certainly needs to be understood by TRADERS that the market is a reflection of the strength of the economy based on the participants within that economy, and I would argue that what we are looking at is a stronger economy from the perspective of those that are currently operating within the economy. Keep in mind that we currently have the lowest percentage of people participating in the workforce since the 1930s, but we also have the smallest percentage of people with money in the markets. That's as opposed to just 13 years ago, when we had more people with money in the market than ever.
Keep in mind that the main reason that we are not in a Great Depression like the 1930's is because the stock market has come back as well as it has. If the S&P was lingering at 800 or less today still after the drop in 2008, there would be almost no economic activity at all at this point. The key is...it may not yet be bringing everyone along, and it might not ever, but the economy is moving and growing at a pace that you wouldn't necessarily expect after a collapse. A lot of the job issues remain because we aren't putting people back to work with infrastructure projects, which has always been a significant component of employment in this country.
From a macro-economic perspective, when historians compare post-1929 and post-2008, lessons should be learned easily about the better model for pulling us out of the long-term ramifications. A lot of people whine about QE and even about the stimulus, but I would argue that both are working, and the stimulus wasn't really as much of a true stimulus as it should have been and could have been bigger to fix the problem faster. But if you go back to 1929, nothing was done, and after the 50% collapse and Crash of 1929, the market actually proceeded lower over the next few years until it hit bottom at a NINETY percent correction from the top:
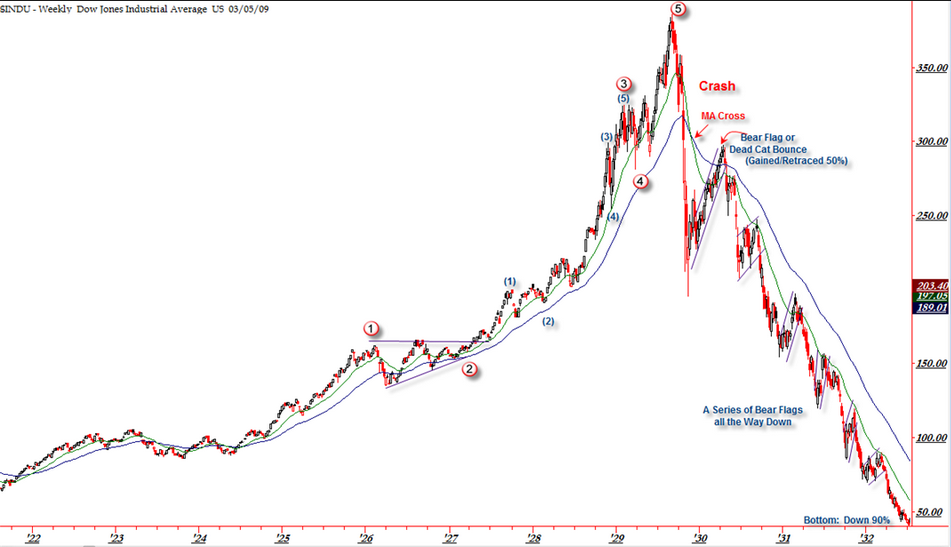
Keep in mind that after the crash in 1929, the worst unemployment numbers were when the headline number was over 20% from 1932 to 1935. Now, we can argue about which unemployment number is the one that matter, but we can't ignore the fact that peak unemployment hit within 18 months of the market bottom. There's a reason for that.
Even more interesting is a look at the NDX side of the equation in monthly bars:
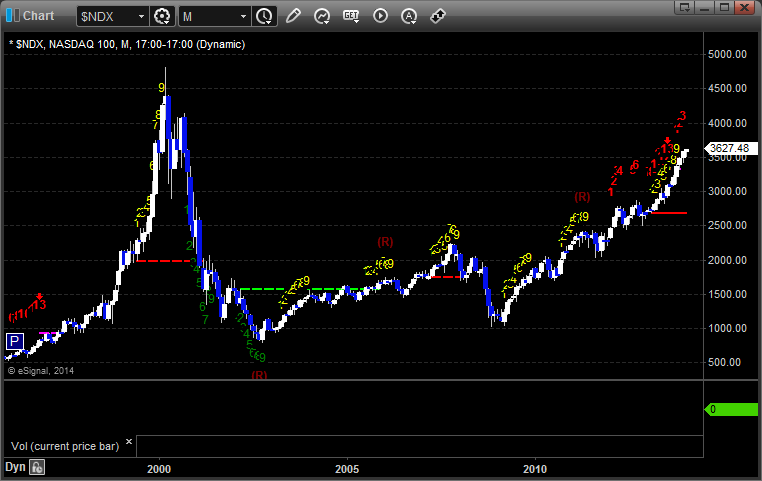
Remember that when you look at the tech stocks, they got out further ahead of themselves in the tech bubble leading up to 2000 and dropped much worse back then. The 2008 banking drop, while it was sharp, looks much smaller on the NASDAQ side. That's not a good thing for the economy, as the S&P is a much broader index, but this current move is really the sign that the economy is moving again. The NDX has been at new highs for the 2000s since 2011 and this year was the break away year. Even if we do rollover, you'll find a lot of support down the road at 2400 or so on the NDX. Heading back to 1000 seems unlikely.
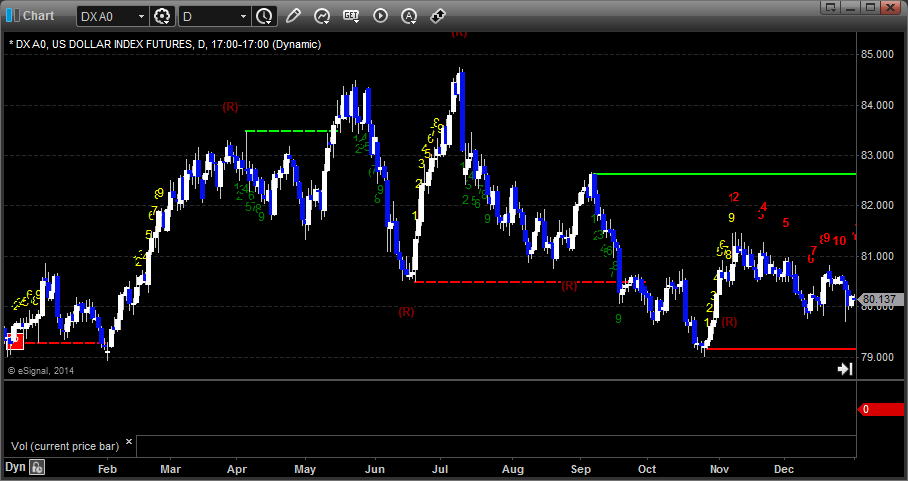
Let's now look at the the Forex markets, which gave us a solid year of trading, but strangely in a very narrow range. I did some adjusting to how I made the calls in 2013, and it seems to have paid off. First, the US Dollar Index itself was basically in a 5 point range for the year, which is not big, and we didn't have a single Seeker buy or sell signal for the year:
If we look at the EURUSD in particular, which is the most common pair that we trade, here's what you get:
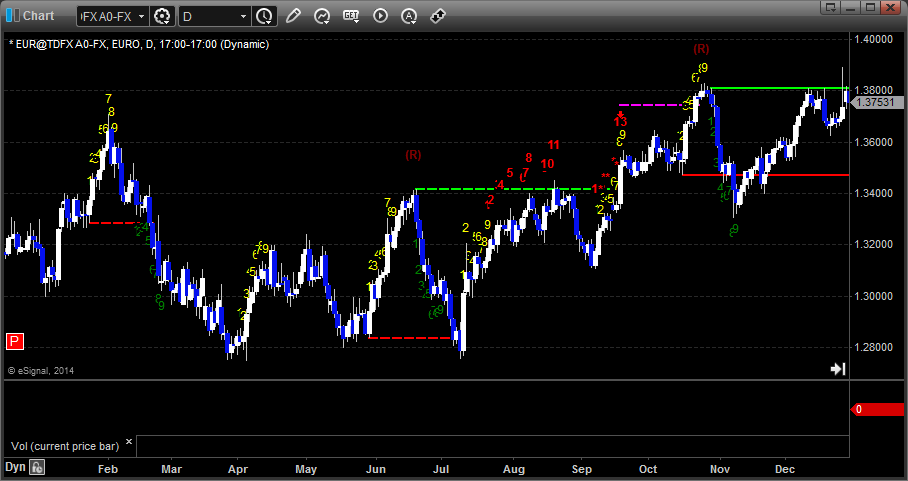
It's a nice cup and handle in general, and it closed out near the highs of the year, but note that the total range of the year was from 1.2800 to 1.3800, which is basically 1000 pips. Sounds like a lot, but note that the EURUSD covered 1400 pips in 2012:
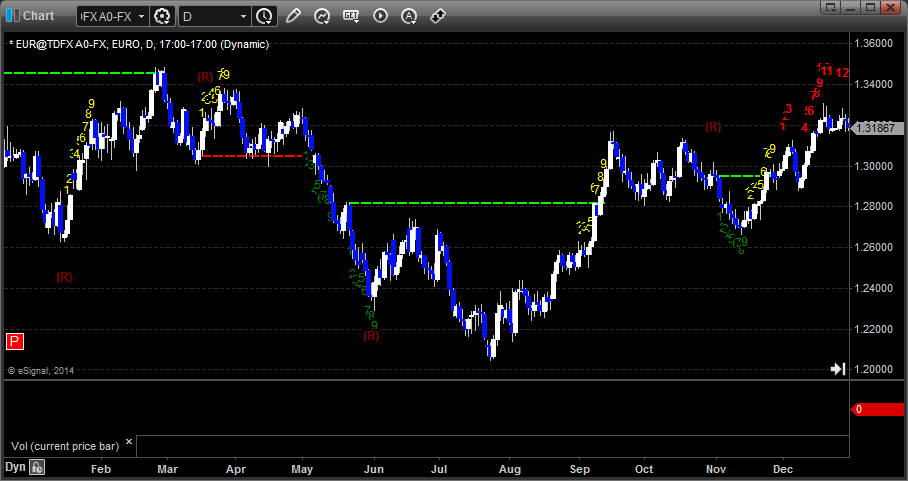
And over 2000 pips in 2011:
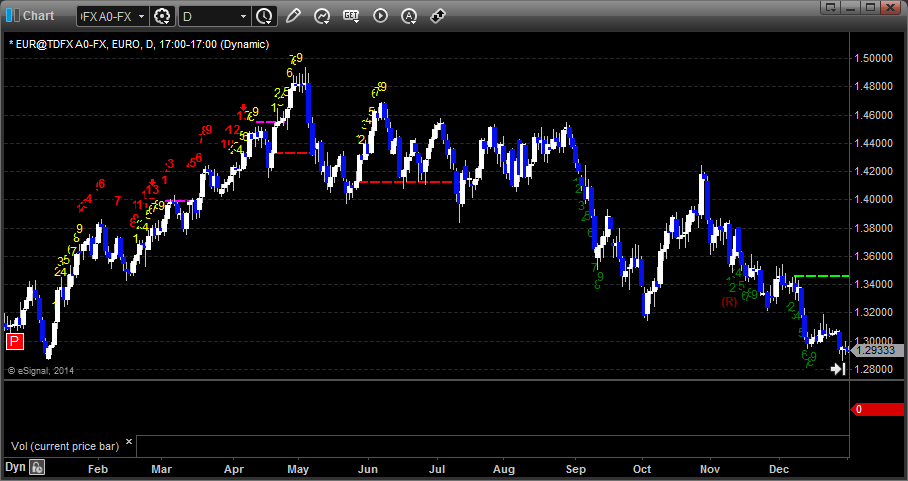
So as good a year as we had in Forex, we made it without seeing big moves that we were able to capture as often over the course of several days.
Here's our second biggest trader, the GBPUSD, which did see 1700 pips of range:
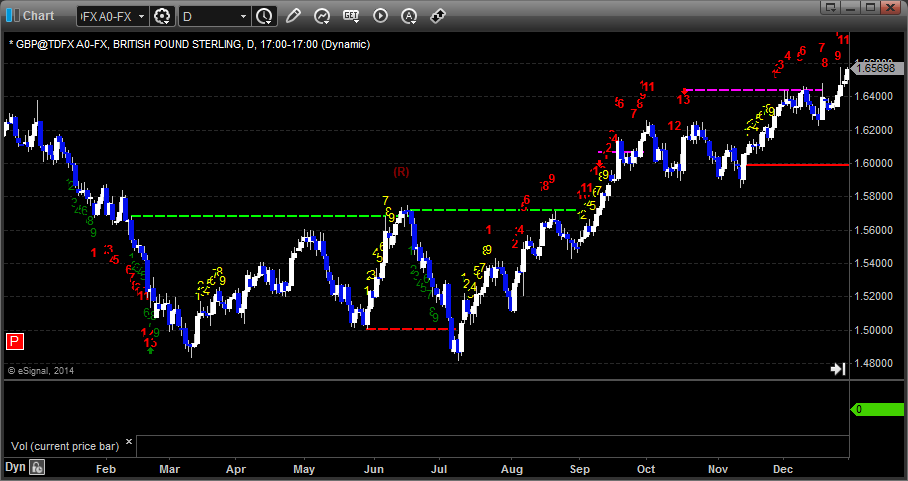
Meanwhile, daily ranges on the pairs remain below the historic averages of the last 10 years. The EURUSD ended the year with a 6 month trailing daily range average of 85 pips per day, which is about the same as where it ended 2012, but well under the 130 that was more common throughout the 2000s. The GBPUSD, on the other hand, did expand daily ranges from about 85 pips a day to 103 pips a day from the start to finish of 2013. That's actually a big bump and helps explain the better results as we had a lot of calls in GBPUSD.
So that's a wrap on 2013, which was a great year for Tradesight as a whole.
Looking forward, the first thing to be aware of is whether the market sells off at some point between the start of the year and April to take some of the tax gains from the run. Also, we have the general rule that if the first 3 days of January head in one direction, the rest of January typically heads in the other direction.
Don't assume that a drop is coming. That's a mistake that amateurs make. If more people get back to work, this "recovery" will only gain steam in catching up to where the economy should have been without the 2008 collapse. We can still run. It's our job to key you into areas where a rollover might occur, such as when the S&P or NDX gets a 13 exhaustion signal. However, as I stress each time that happens, that does NOT mean that we immediately start shorting the market. We need confirmation to get excited about that direction, and we need to remain focused on chart patterns and intraday market direction when taking trades. Our goal isn't to project or assume that the market has to do anything. The only thing it has to do each day is open and close.
For 2014, I think volume in the stock markets will improve (the opening days are already better). Better volume will hopefully lead to wider intraday ranges, which will lead to better futures trading, and we might get back to making more futures calls per day. I wrote a couple of articles in the Market Blog this year about how I view the asset classes. I continue to favor stocks, then Forex, then futures. If Forex ranges do NOT expand, as they didn't in 2013 in general and certainly didn't in the back 5 months of the year after summer vacation, but stock market volume does, I would expect to start to slightly favor futures over Forex. For now, my order of priority daily for trading and making money remains Stocks, then Forex, then Futures.
We hope to be here for your trading needs in 2014 again. We have a lot of exciting things planned in 2014, including the expansion of our 6-month mentoring program for stocks (futures and Forex coming soon). Thank you for being the best subscribers in the world.
2013 Market Recap and 2014 Preview
Every year, we wrap the year with a summary of what the markets did for the year and a general discussion of our results. If you'll recall, in the report at the end of 2012 leading into 2013, we had just averted the Fiscal Cliff although the extension to the debt ceiling had only been two months. My expectation was that market volume would pick up, stocks would remain solid and maybe even get better from a trading perspective, Forex would definitely improve, and futures might see better action as well if volumes picked up. Two out of three isn't bad.
We had a tremendous year once again trading stocks, although we will talk in a bit about what a ridiculous year it was for the stock market. Usually, we rely on making money on both the upside and downside of the markets, and 2013 was a year that was only about the long side. Forex did improve a bit in terms of ranges. The problem remained futures, as volume in the stock market dipped to the worst in 15 years.
In the end, we had a terrific year of Forex results even though we dropped to half size in August and never raised it back up because the ranges didn't return. We ended up with 11 out of 12 months profitable in Forex and almost 1900 pips of net gains. Futures had two poor months early that hurt the net results for the year. Our methods for stock trading continued to work well, and we ended up winning 67% of our stock calls that triggered with market directional support. That's a pretty nice result.
Let's start first with the topic of market volume. Here is NASDAQ volume daily in 2013 with a 10 day moving average:

As you can see, we never had a point where the 10 day volume average came near 2 billion shares, and I would say that the average for the year was 1.7 or less. We had the usual dip in August for summer vacations, although this dipped more than usual, and we had a really weak last two weeks instead of just one because the Holidays were on Wednesdays.
Still, if you compare it to 2012, where the average was up closer to 1.8 billion shares even if the moving average never got over 2 billion, and 2013 is the worst volume year in a long time:

For the record, we should also look at 2011, where the average spent most of the year over 2 billion:

Without volume, trading the futures is a much tougher business. There are still plenty of stocks moving on any given day because there are thousands of stocks to scan and choose from, but the ranges on the futures dipped, and there were a lot of days where we didn't see the volatility in the first hour or so that we usually do.
Let's move on and discuss the indices, because this is where 2013 is so strange. Despite all of the issues in Washington and the lack of volume, the markets kept chugging along and put in one of their best years on record. The S&P closed 2012 at 1426.19 and closed 2013 at 1848.36, a gain of 422.17 points or 29.6%. Here's the chart:

Note that even though we did get a couple of brief pullbacks in June and August (when there was even less volume), the S&P shrugged off 4 separate Seeker 13 sell signals and NEVER EVEN HAD A SINGLE 9-BAR START-UP PHASE to the downside. That is remarkable.
The same is basically true of the NDX 100, the NASDAQ index, which also shrugged off 4 separate Seeker 13 sell signals without a downward start-up. NDX closed 2012 at 2660.93 and closed 2013 at 3592 exactly, up 931.07 points or 34.9%:

To look at two of the other sub-sectors that we follow closely, the SOX (Semiconductor Index) had a solid year:

As did the Biotechs (NBI), which were up 65%, but did have several 9 bar START-UP phases to the downside, each of which was a short term low along the way:

Usually when I do these end of year summaries, I have a lot of trend lines to draw to show where various up and down trends ended back and forth. There is none of that to do this year when it comes to the major equity indices. The back two months of the year, as I kept saying OVER and OVER at the time, was almost destined to close higher because stocks were up so much for the year and no one wanted to sell and lock in the trading gains and have to pay taxes for the year. Without sellers, those stocks tend to push higher in the last month or two of the year, which is exactly what happened, and we closed out near the highs.
Let's look at some of the individual stocks that we traded over and over (our popular traders) and then we will put the current location of the market in a broader context, and then we will discuss Forex a bit.
AAPL is historically one of the stocks that we trade a lot. It came into the year in the middle of a sharp sell-off from 2012 that we had called. Our targets had been $420 and then $370. 420 hit, and I still think 370 will be a target someday. In the end, the stock rallied in the second half of the year enough to come back and close just barely green for the year (conveniently, so AAPL can continue to show positive results for investors year over year. Note that there was only 1 Seeker buy signal and 1 Seeker sell signal for the year:

Meanwhile, where AAPL loses, GOOG gains, and GOOG had a remarkable run for the year. There was little chance people would be selling this stock late in the year, and it closed at highs. Note that with that, there was only 1 Seeker signal for the year, and it was a sell during the Holidays in December after the big run:

AMZN was another big winner, and another great example of how stocks that are up for the year tend to run even harder in November and December:

Facebook (FB), which was a debacle coming public in 2012 and trapped a lot of money that usually would be trading in the markets, finally got back to its IPO price at $42 and then launched higher (again, no sellers once it hit prices that no one owned it at). Note that market action and volume improved as people were able to get that money out of FB, and I had commented last year that FB's IPO itself played a big role in total market volume dropping, so that is really an important point to note. There were NO SEEKER signals either way the whole year on FB:

If there was a new stock on the block that could have been a problem like FB was in 2012, it was Twitter (TWTR), which came public late in the year at $26 a share but opened in the 40's and actually stayed there. Once again, though, here is even a better example of how the tax selling issue works. Here is a stock that no one owned over $26 when it came public. Anyone that jumped in in the 40's early may have not seen an results, but again, if most people own the stock at 26 and it has only traded up 50% or more from that, who wants to sell and lock in that level of gain? And in fact, with the stock so new, many types of shares can't be sold. This combination leads to a big squeeze in the last days of the year when the sellers dry up completely and there are no shares available to short. Some might confuse this as being a function of the value of TWTR, but it is not. Don't be surprised if this is the high in TWTR for a while:

TSLA also had a great year, moving from under 40 to almost 200, and even though it gapped down a bit on the last earnings report of the year, it is still a solid return for investors and one that no one was in a rush to lock in during November and December:

Another that we traded frequently was NFLX which had a solid year in general:

I should also note that money continued to move out of Gold, which also probably helped push the stock market. Note the Seeker 13 buy signal late in the year that has so far been a floor:

And also we need to do our annual check of crude oil, which actually spent most of the year between 85 and 98, although it did have that beautiful breakout in July that pushed it up to $112 during the usual hot part of the year (and Hurricane season). Note that there was a Seeker sell signal at the high and a Seeker buy signal at the November low:

So where does this put us in the broader context of the S&P 500 and NDX indices? Well, it's quite interesting in general.
Here is the S&P 500 monthly chart going back to 1996 or so:

The first drop is obviously the bursting of the Y2K/Internet bubble that took the market from 1500 as we came into the decade to a low of 800 or so in 2003. We then rallied off of that for about 4 years, making it just back to the highs, and then rolled. We called that drop from the point that oil first broke above $80 a barrel back in 2007, and that led to a crumbling of the market at a record pace and the banking collapse of 2008. The low of the market hit in March 2009 as the stimulus started to take hold, and the market has now officially broken out, aided by QE3 as some would say, and running. Unemployment remains a problem in real terms, but that should not be confused with the growth rate of the economy. We still need to get people back to work to complete the repairs, as some might say, but we also shouldn't confuse the fact that technologically and with outsourcing of many labor factors to other countries, we may not get back to a point of full employment again. While that doesn't help the people in the bottom 20%, it certainly needs to be understood by TRADERS that the market is a reflection of the strength of the economy based on the participants within that economy, and I would argue that what we are looking at is a stronger economy from the perspective of those that are currently operating within the economy. Keep in mind that we currently have the lowest percentage of people participating in the workforce since the 1930s, but we also have the smallest percentage of people with money in the markets. That's as opposed to just 13 years ago, when we had more people with money in the market than ever.
Keep in mind that the main reason that we are not in a Great Depression like the 1930's is because the stock market has come back as well as it has. If the S&P was lingering at 800 or less today still after the drop in 2008, there would be almost no economic activity at all at this point. The key is...it may not yet be bringing everyone along, and it might not ever, but the economy is moving and growing at a pace that you wouldn't necessarily expect after a collapse. A lot of the job issues remain because we aren't putting people back to work with infrastructure projects, which has always been a significant component of employment in this country.
From a macro-economic perspective, when historians compare post-1929 and post-2008, lessons should be learned easily about the better model for pulling us out of the long-term ramifications. A lot of people whine about QE and even about the stimulus, but I would argue that both are working, and the stimulus wasn't really as much of a true stimulus as it should have been and could have been bigger to fix the problem faster. But if you go back to 1929, nothing was done, and after the 50% collapse and Crash of 1929, the market actually proceeded lower over the next few years until it hit bottom at a NINETY percent correction from the top:

Keep in mind that after the crash in 1929, the worst unemployment numbers were when the headline number was over 20% from 1932 to 1935. Now, we can argue about which unemployment number is the one that matter, but we can't ignore the fact that peak unemployment hit within 18 months of the market bottom. There's a reason for that.
Even more interesting is a look at the NDX side of the equation in monthly bars:

Remember that when you look at the tech stocks, they got out further ahead of themselves in the tech bubble leading up to 2000 and dropped much worse back then. The 2008 banking drop, while it was sharp, looks much smaller on the NASDAQ side. That's not a good thing for the economy, as the S&P is a much broader index, but this current move is really the sign that the economy is moving again. The NDX has been at new highs for the 2000s since 2011 and this year was the break away year. Even if we do rollover, you'll find a lot of support down the road at 2400 or so on the NDX. Heading back to 1000 seems unlikely.
Let's now look at the the Forex markets, which gave us a solid year of trading, but strangely in a very narrow range. I did some adjusting to how I made the calls in 2013, and it seems to have paid off. First, the US Dollar Index itself was basically in a 5 point range for the year, which is not big, and we didn't have a single Seeker buy or sell signal for the year:

If we look at the EURUSD in particular, which is the most common pair that we trade, here's what you get:

It's a nice cup and handle in general, and it closed out near the highs of the year, but note that the total range of the year was from 1.2800 to 1.3800, which is basically 1000 pips. Sounds like a lot, but note that the EURUSD covered 1400 pips in 2012:

And over 2000 pips in 2011:

So as good a year as we had in Forex, we made it without seeing big moves that we were able to capture as often over the course of several days.
Here's our second biggest trader, the GBPUSD, which did see 1700 pips of range:

Meanwhile, daily ranges on the pairs remain below the historic averages of the last 10 years. The EURUSD ended the year with a 6 month trailing daily range average of 85 pips per day, which is about the same as where it ended 2012, but well under the 130 that was more common throughout the 2000s. The GBPUSD, on the other hand, did expand daily ranges from about 85 pips a day to 103 pips a day from the start to finish of 2013. That's actually a big bump and helps explain the better results as we had a lot of calls in GBPUSD.
So that's a wrap on 2013, which was a great year for Tradesight as a whole.
Looking forward, the first thing to be aware of is whether the market sells off at some point between the start of the year and April to take some of the tax gains from the run. Also, we have the general rule that if the first 3 days of January head in one direction, the rest of January typically heads in the other direction.
Don't assume that a drop is coming. That's a mistake that amateurs make. If more people get back to work, this "recovery" will only gain steam in catching up to where the economy should have been without the 2008 collapse. We can still run. It's our job to key you into areas where a rollover might occur, such as when the S&P or NDX gets a 13 exhaustion signal. However, as I stress each time that happens, that does NOT mean that we immediately start shorting the market. We need confirmation to get excited about that direction, and we need to remain focused on chart patterns and intraday market direction when taking trades. Our goal isn't to project or assume that the market has to do anything. The only thing it has to do each day is open and close.
For 2014, I think volume in the stock markets will improve (the opening days are already better). Better volume will hopefully lead to wider intraday ranges, which will lead to better futures trading, and we might get back to making more futures calls per day. I wrote a couple of articles in the Market Blog this year about how I view the asset classes. I continue to favor stocks, then Forex, then futures. If Forex ranges do NOT expand, as they didn't in 2013 in general and certainly didn't in the back 5 months of the year after summer vacation, but stock market volume does, I would expect to start to slightly favor futures over Forex. For now, my order of priority daily for trading and making money remains Stocks, then Forex, then Futures.
We hope to be here for your trading needs in 2014 again. We have a lot of exciting things planned in 2014, including the expansion of our 6-month mentoring program for stocks (futures and Forex coming soon). Thank you for being the best subscribers in the world.
Stock Picks Recap for 1/17/14
With each stock's recap, we will include a (with market support) or (without market support) tag, designating whether the trade triggered with or without market directional support at the time. Anything in the first five minutes will be considered WITHOUT market support because market direction cannot be determined that early. ETF calls do not require market support, and are thus either winners or losers.
From the report, nothing triggered.
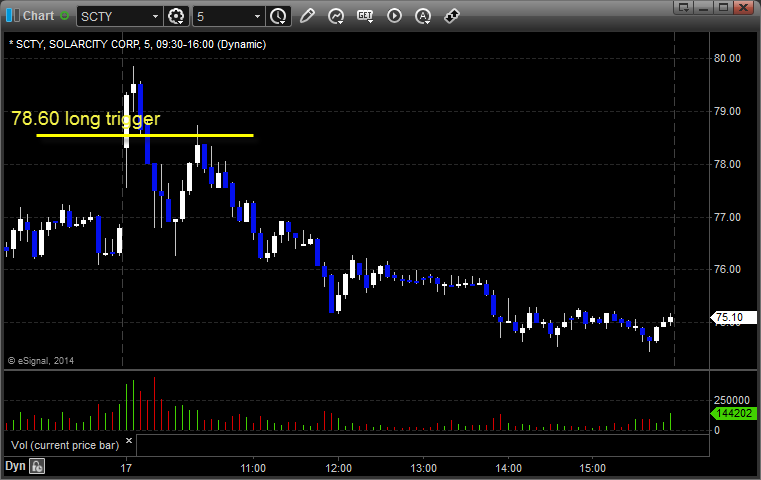
From the Messenger/Tradesight_st Twitter Feed, Rich's SCTY triggered long (without market support due to opening 5 minutes) and worked:
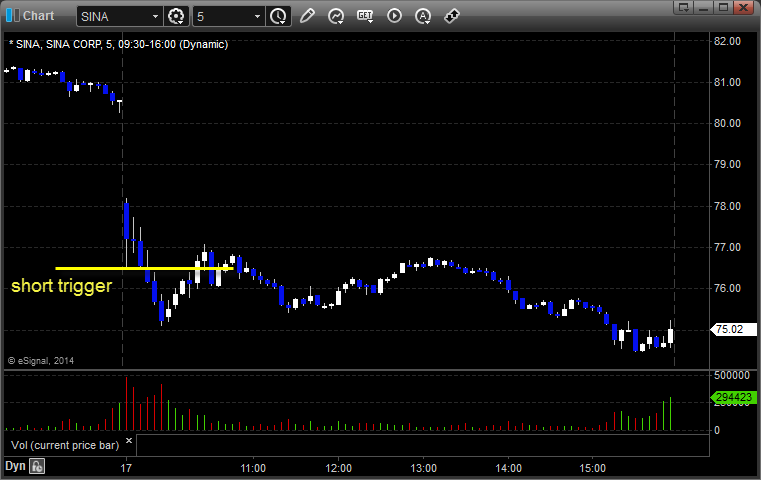
His SINA triggered short (with market support) and worked:
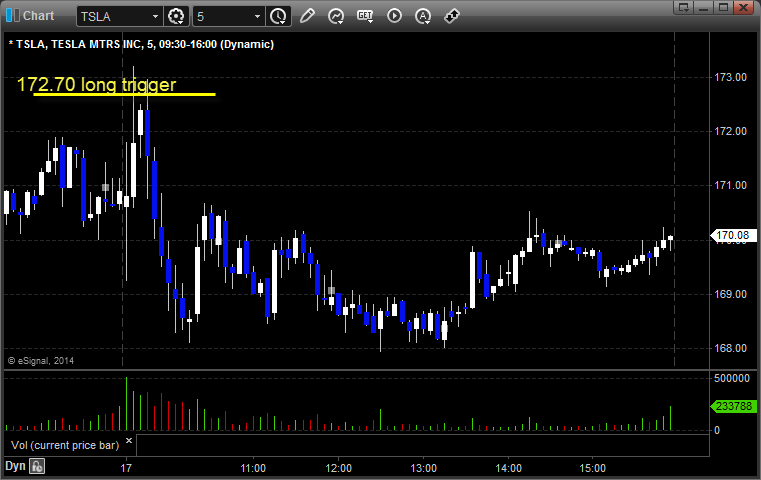
TSLA triggered long (with market support) and didn't work:
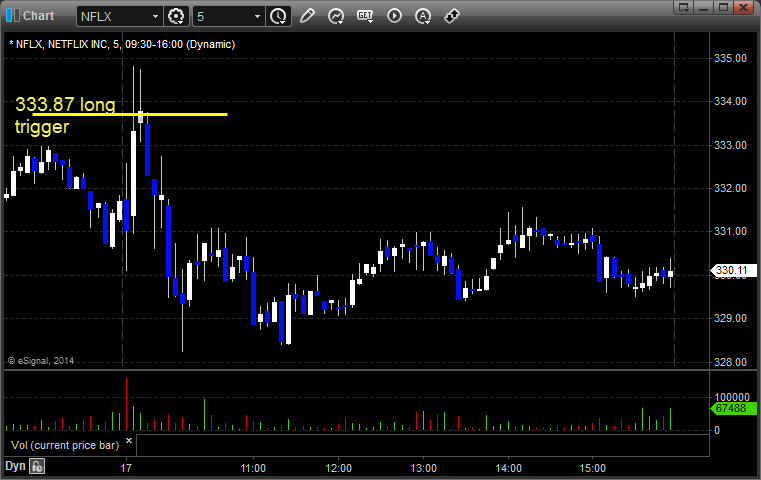
NFLX triggered long (with market support) and worked enough for a partial:
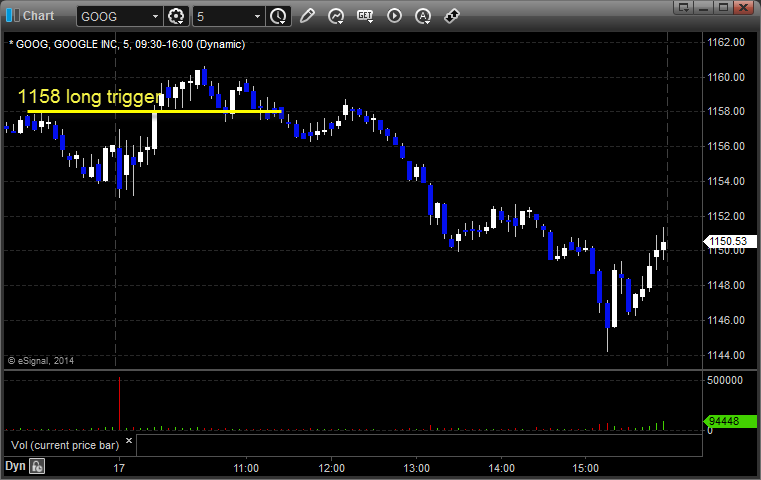
GOOG triggered long (without market support) and worked for a couple of points:
In total, that's 3 trades triggering with market support, 2 of them worked, 1 did not.
Stock Picks Recap for 1/17/14
With each stock's recap, we will include a (with market support) or (without market support) tag, designating whether the trade triggered with or without market directional support at the time. Anything in the first five minutes will be considered WITHOUT market support because market direction cannot be determined that early. ETF calls do not require market support, and are thus either winners or losers.
From the report, nothing triggered.
From the Messenger/Tradesight_st Twitter Feed, Rich's SCTY triggered long (without market support due to opening 5 minutes) and worked:

His SINA triggered short (with market support) and worked:

TSLA triggered long (with market support) and didn't work:

NFLX triggered long (with market support) and worked enough for a partial:

GOOG triggered long (without market support) and worked for a couple of points:

In total, that's 3 trades triggering with market support, 2 of them worked, 1 did not.
Futures Calls Recap for 1/17/14
One loser and two winners, one short the ES and one long the NQ, to end the week. Neither did anything beyond its first target as the ranges were narrow as expected for options expiration heading into a 3-day weekend. See both of those sections below.
Net ticks: -1.5 ticks.
As usual, let's start by taking a look at the ES and NQ with our market directional lines, VWAP, and Comber on the 5-minute chart from today's session:
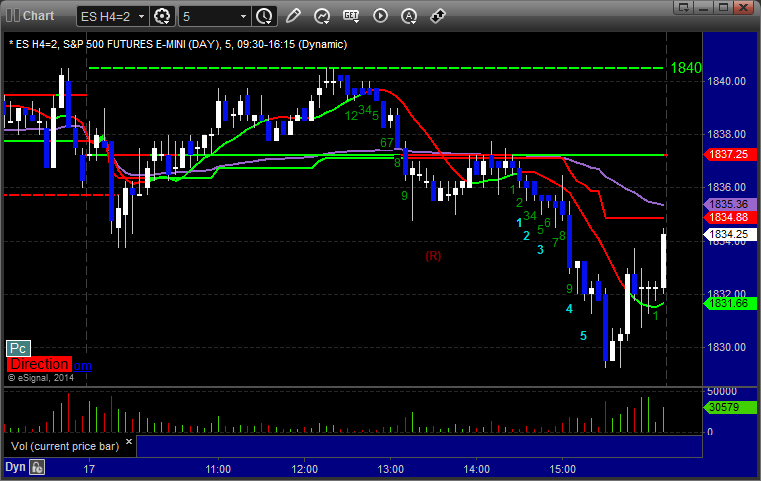
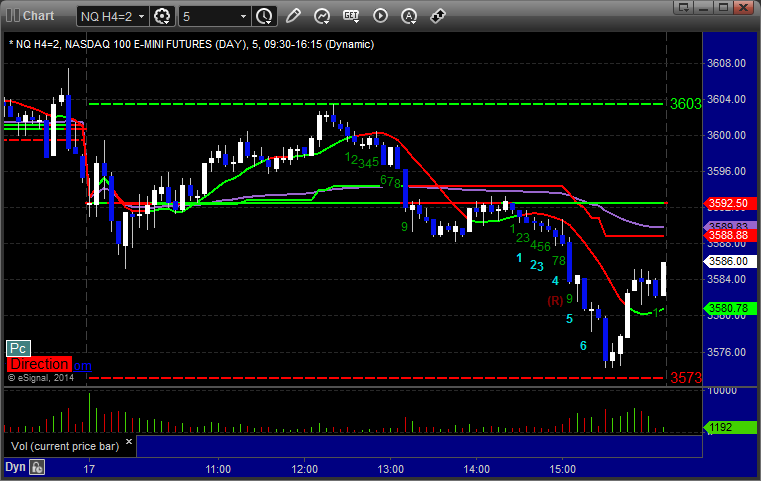
ES:
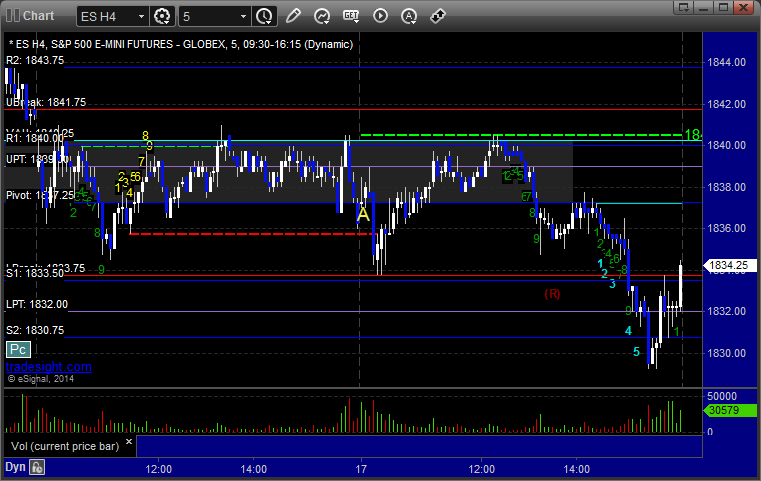
My call triggered short at A at 1836.50, hit first target for 6 ticks, and stopped the second half AT the entry level (not over it):
NQ:
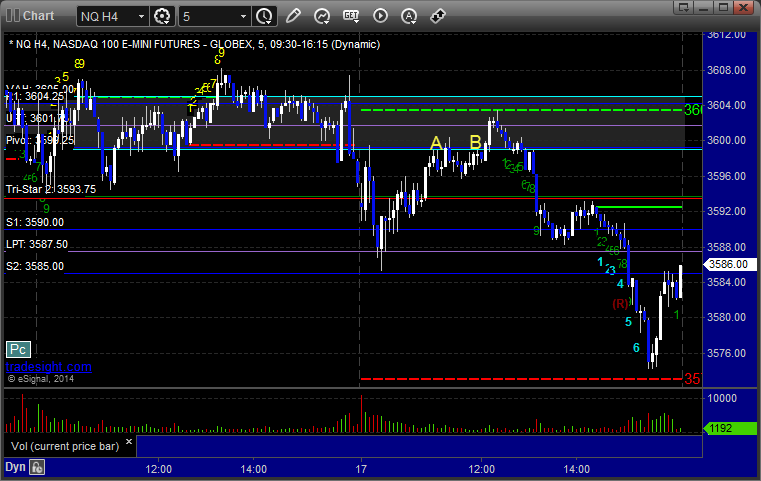
Just a reminder that we use half points for ticks on the NQ and not the quarter point measurement that the exchanges switched to in recent years. This allows us to use 6 ticks as a key target as we do on the other contracts. It also keeps the value of a tick at $10, closer to the value of a tick on the other contracts.
Mark's call triggered long at A at 3600.00, sweeping the trigger and stopping. It triggered again at B hit first target for 6 ticks, and stopped the second half under the entry:
Forex Calls Recap for 1/17/14
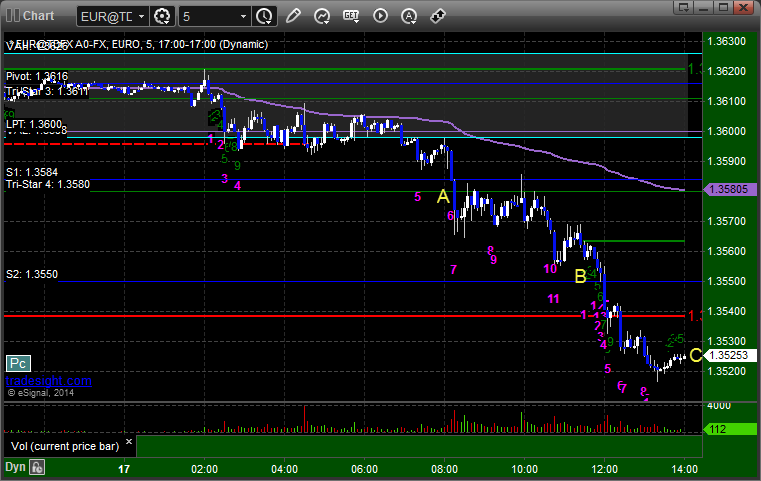
Closed out the week with a nice winner in the EURUSD, and the AUDUSD also did the Value Area move that I pointed out. See both sections below.
Here's a look at the US Dollar Index intraday with our market directional lines:
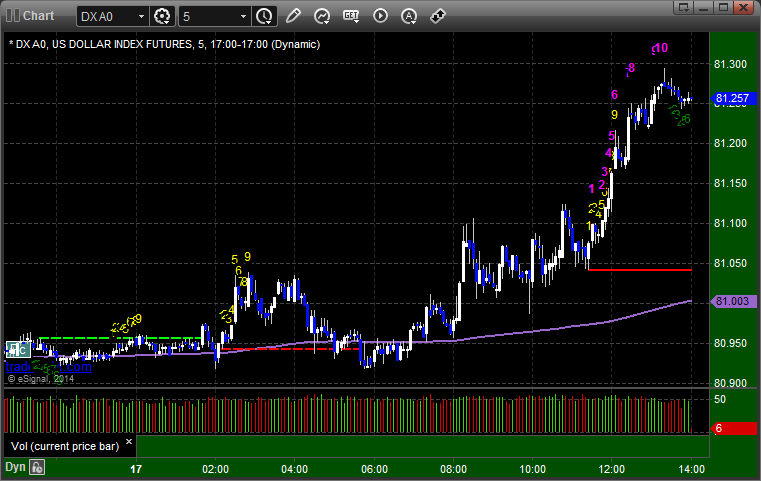
As usual on the Sunday report, we will look at the action from Thursday night/Friday, then look at the daily charts of all the pairs with the Seeker and Comber separately for the week ahead, and then glance at the US Dollar Index.
EURUSD:
Triggered short at A, hit first target at B, closed for 50 pips at C for end of week:
Stock Picks Recap for 1/16/14
With each stock's recap, we will include a (with market support) or (without market support) tag, designating whether the trade triggered with or without market directional support at the time. Anything in the first five minutes will be considered WITHOUT market support because market direction cannot be determined that early. ETF calls do not require market support, and are thus either winners or losers.
From the report, nothing triggered.
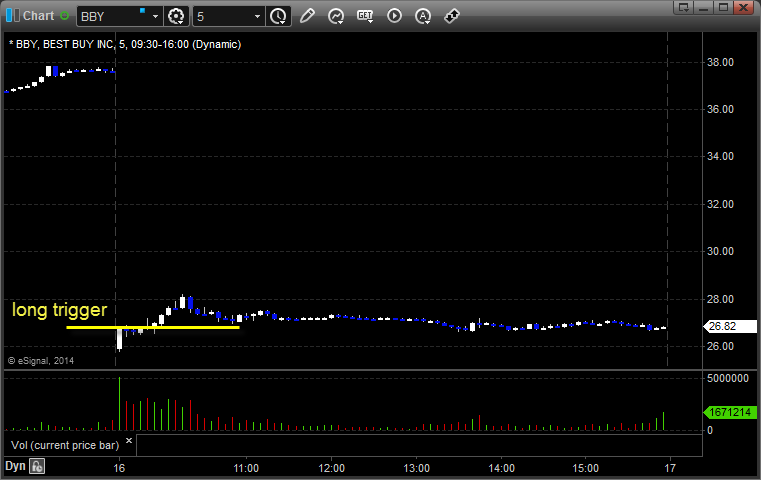
From the Messenger/Tradesight_st Twitter Feed, Rich's BBY triggered long (without market support) and worked:
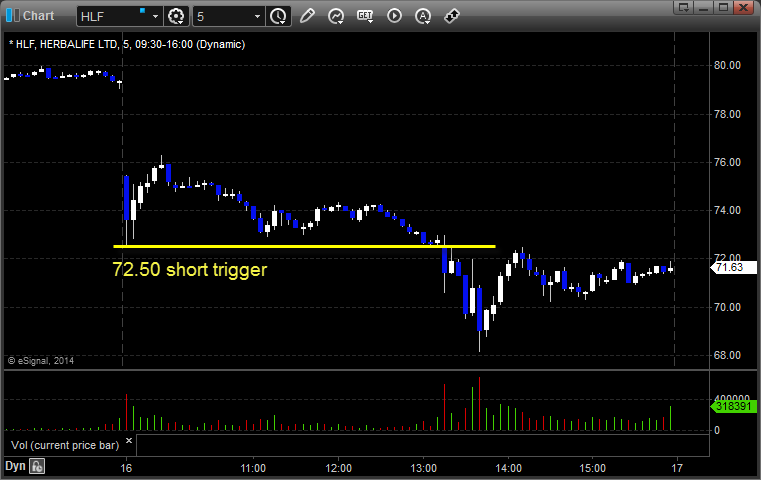
His HLF triggered short (with market support) and worked:
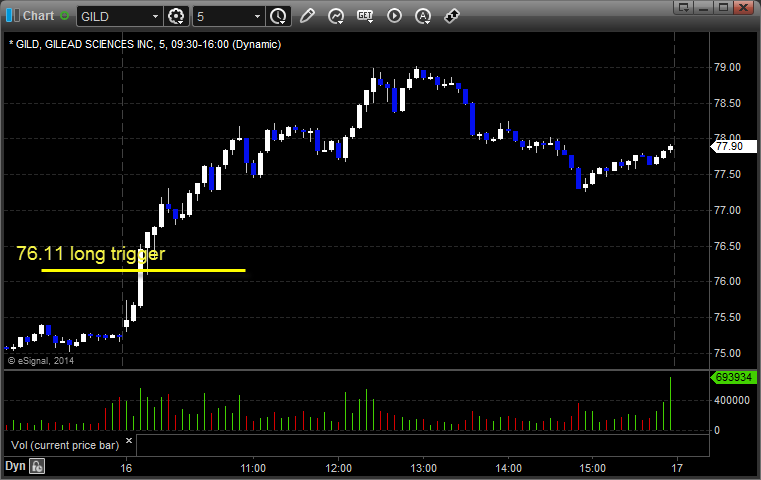
GILD triggered long (without market support) and worked great:
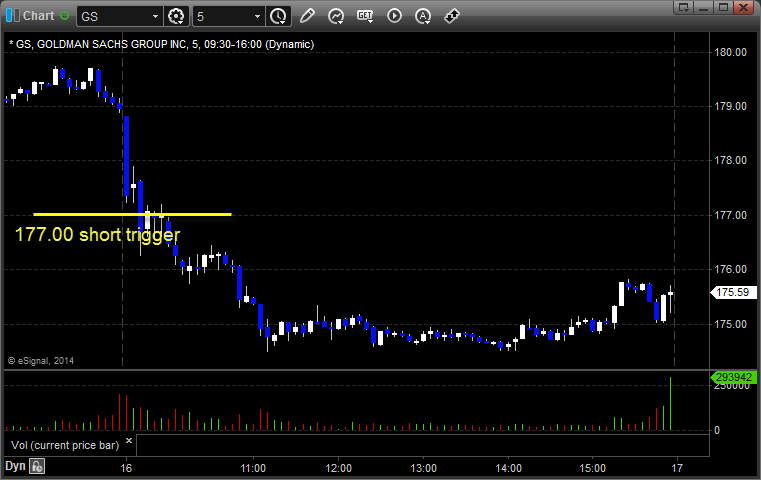
Rich's GS triggered short (with market support) and worked:
GOOG triggered long (with market support) and worked enough for a partial:

Rich's NFLX triggered long (with market support) and worked enough for a partial:

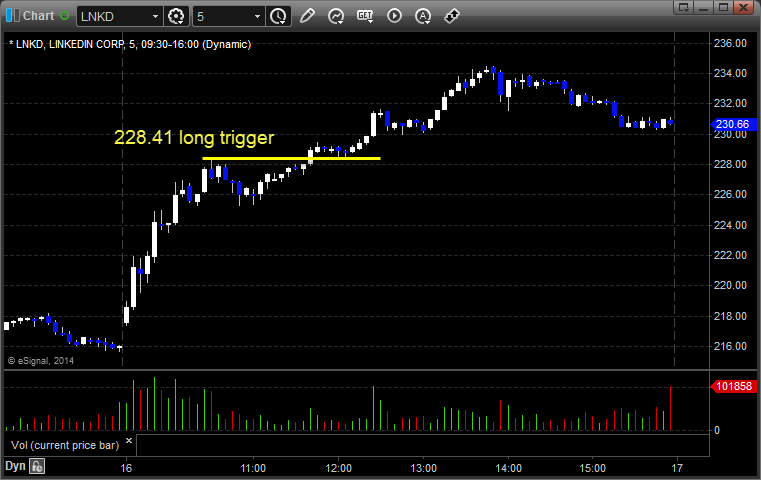
His LNKD triggered long (with market support) and worked:
In total, that's 5 trades triggering with market support, all 5 of them worked.
Stock Picks Recap for 1/16/14
With each stock's recap, we will include a (with market support) or (without market support) tag, designating whether the trade triggered with or without market directional support at the time. Anything in the first five minutes will be considered WITHOUT market support because market direction cannot be determined that early. ETF calls do not require market support, and are thus either winners or losers.
From the report, nothing triggered.
From the Messenger/Tradesight_st Twitter Feed, Rich's BBY triggered long (without market support) and worked:

His HLF triggered short (with market support) and worked:

GILD triggered long (without market support) and worked great:

Rich's GS triggered short (with market support) and worked:

GOOG triggered long (with market support) and worked enough for a partial:

Rich's NFLX triggered long (with market support) and worked enough for a partial:

His LNKD triggered long (with market support) and worked:

In total, that's 5 trades triggering with market support, all 5 of them worked.
Futures Calls Recap for 1/16/14
A winner and a loser with no follow through on the ES on a dull day in the markets. See ES section below. NASDAQ volume closed at 1.8 billion, which is down from the last week.
Net ticks: -4.5 ticks.
As usual, let's start by taking a look at the ES and NQ with our market directional lines, VWAP, and Comber on the 5-minute chart from today's session:


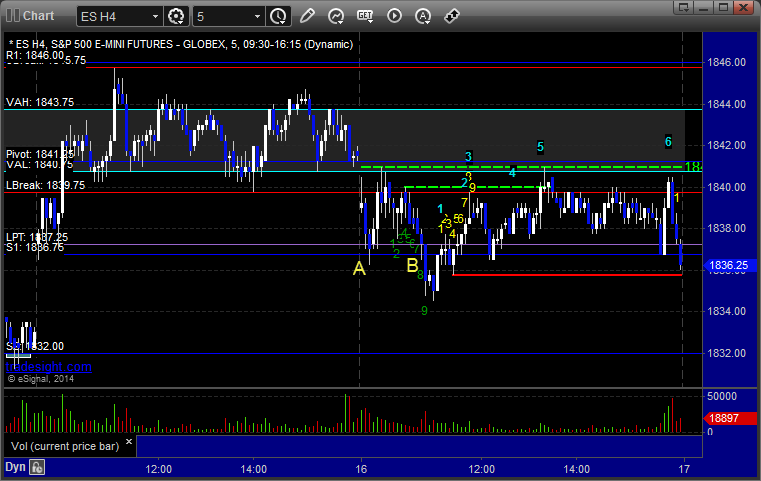
ES:
Triggered short at A at 1836.50 and stopped for 7 ticks. Triggered short again at B at the same price, hit first target, stopped second half over the entry:
