Stock Picks Recap for 6/28/13
With each stock's recap, we will include a (with market support) or (without market support) tag, designating whether the trade triggered with or without market directional support at the time. Anything in the first five minutes will be considered WITHOUT market support because market direction cannot be determined that early. ETF calls do not require market support, and are thus either winners or losers.
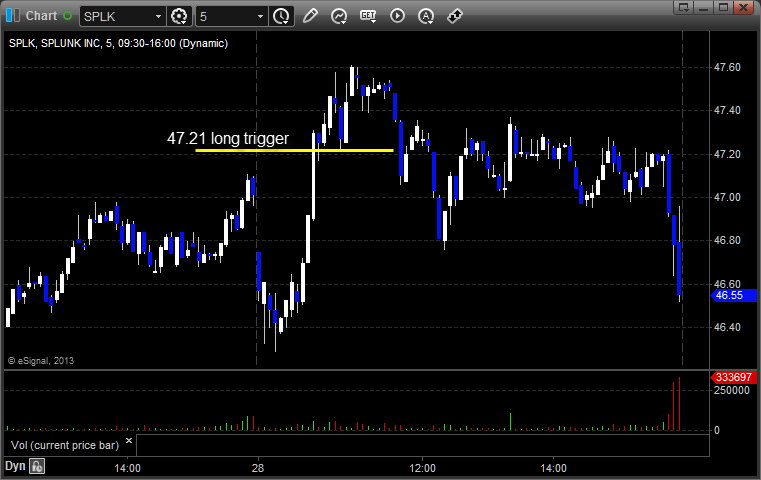
From the report, SPLK triggered long (with market support) and worked enough for a partial:
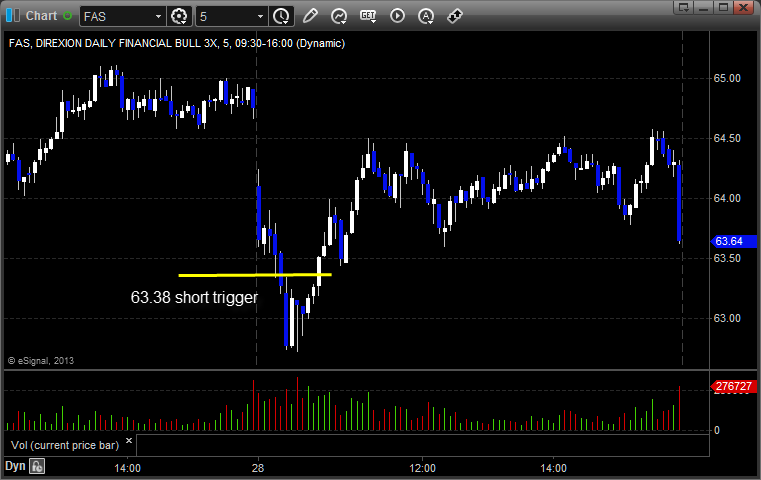
From the Messenger/Tradesight_st Twitter Feed, Rich's FAS triggered short (ETF, so no market support needed) and worked:
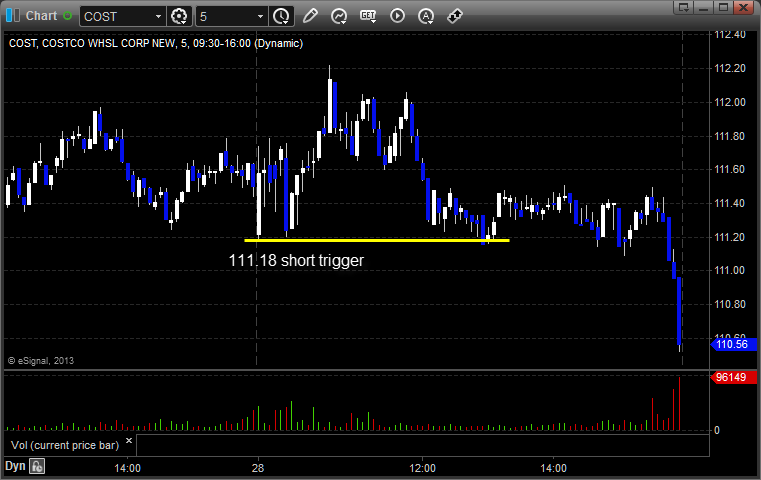
COST triggered short (without market support) and didn't work:
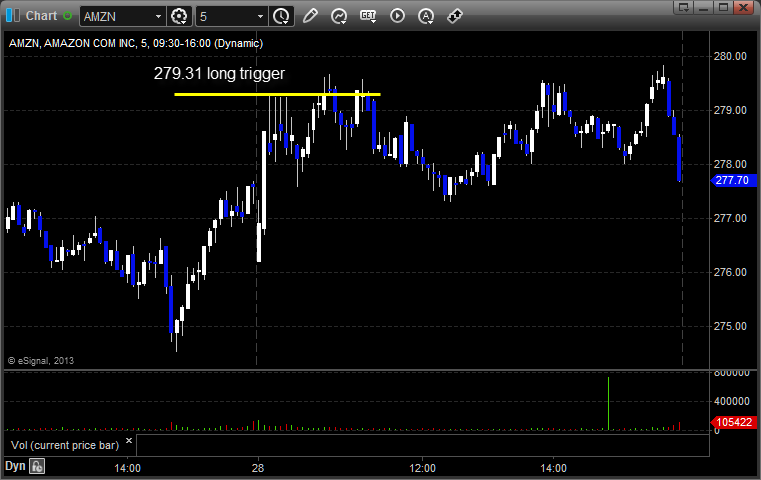
Mark's AMZN triggered long (with market support) and didn't work:
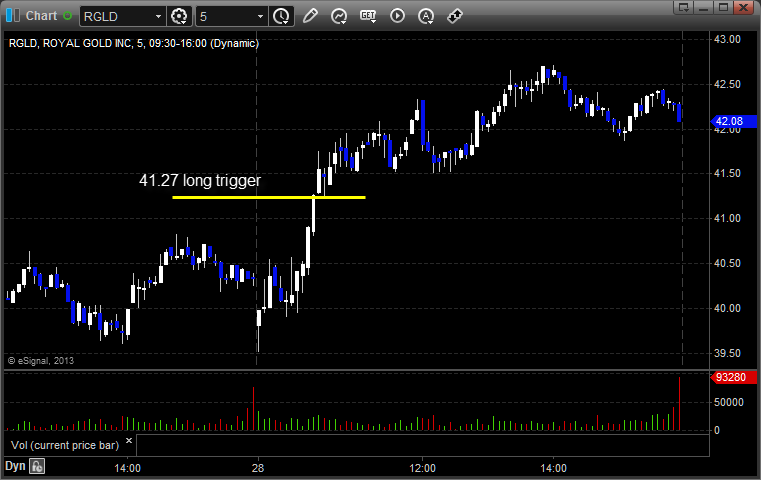
Rich's RGLD triggered long (with market support) and worked:
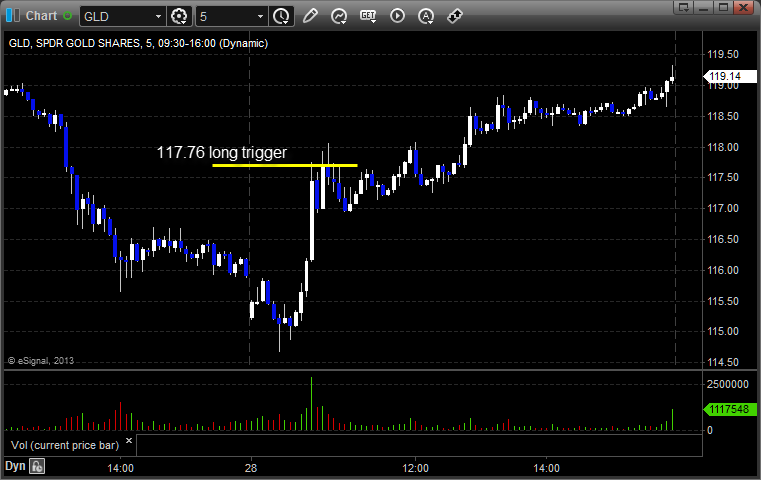
His GLD triggered long (ETF, so no market support needed) and worked:
In total, that's 5 trades triggering with market support, 4 of them worked, 1 did not.
Futures Calls Recap for 6/28/13
A loser on the ES and a small winner on the NQ to close out the week, month, and quarter. See both sections below. Volume closed out at 1.5 billion NASDAQ shares, better than expected, but obviously poor in general. Early action looked horrible, but the market ended up filling both yesterday's gap (by reaching down) and today's gap (by reaching back up) before closing about even.
Net ticks: -4.5 ticks.
As usual, let's start by taking a look at the ES and NQ with our market directional lines, VWAP, and Comber on the 5-minute chart from today's session:
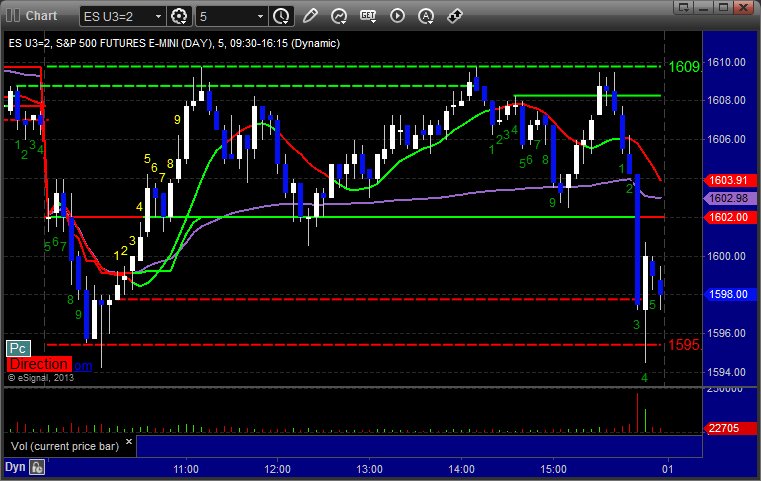
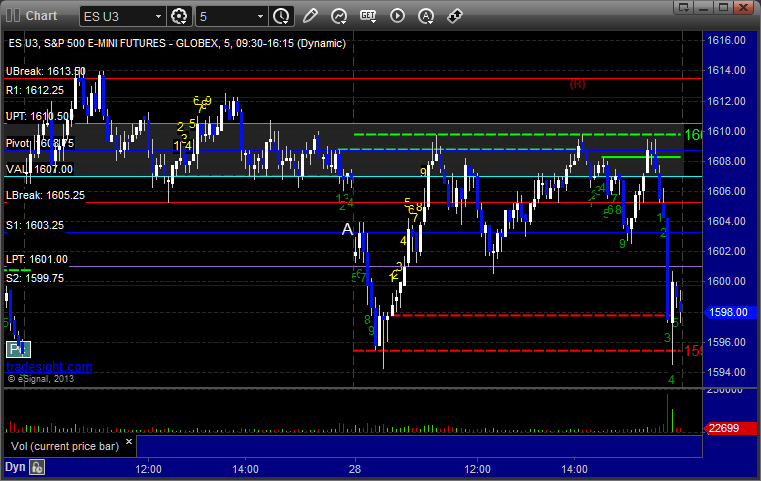
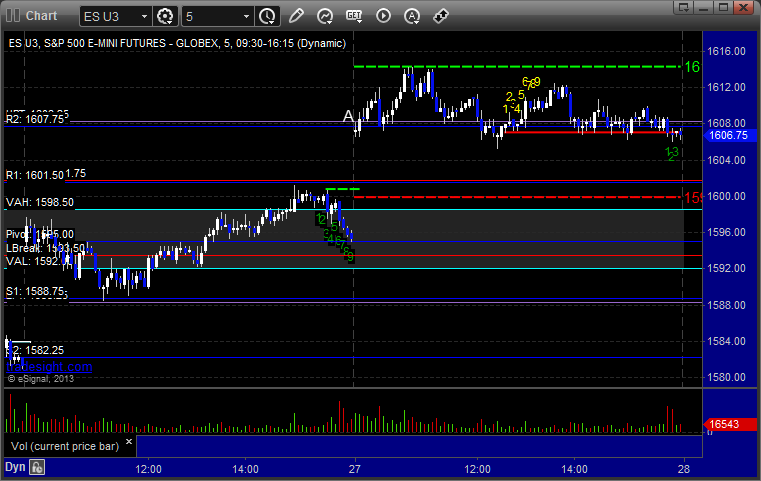
ES:
My ES triggered long at 1603.50 at A and stopped for 7 ticks:
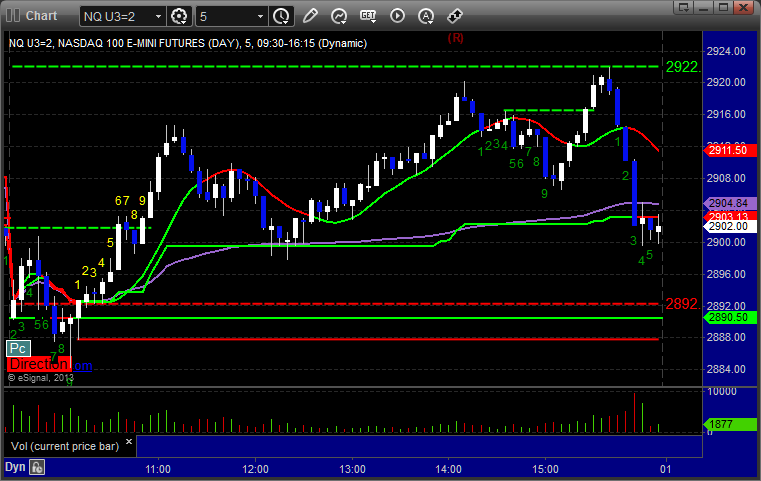
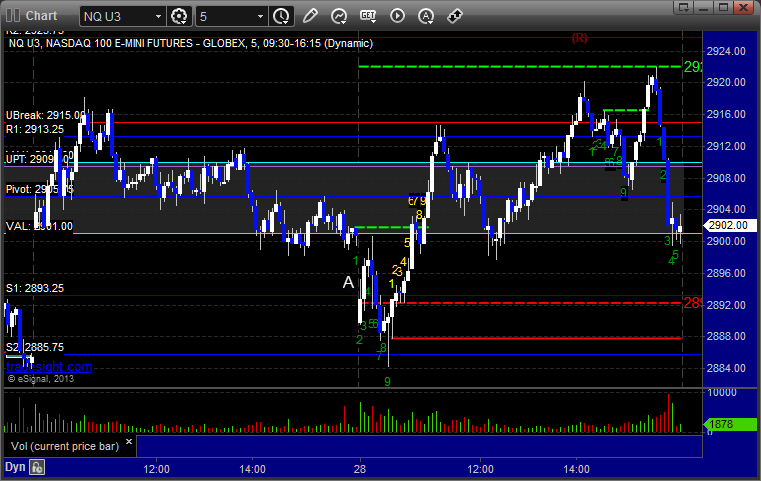
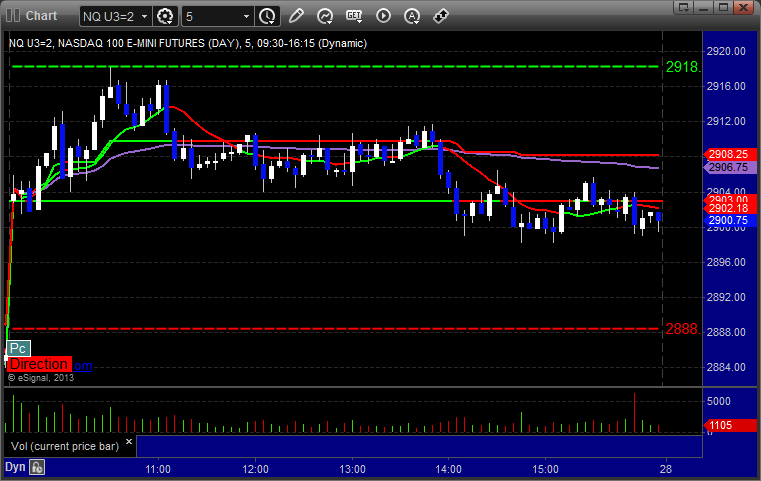
NQ:
Just a reminder that we use half points for ticks on the NQ and not the quarter point measurement that the exchanges switched to in recent years. This allows us to use 6 ticks as a key target as we do on the other contracts. It also keeps the value of a tick at $10, closer to the value of a tick on the other contracts.
Mark's call triggered long at A at 2896.00, hit first target for 6 ticks, and stopped the second half under the entry:
Futures Calls Recap for 6/28/13
A loser on the ES and a small winner on the NQ to close out the week, month, and quarter. See both sections below. Volume closed out at 1.5 billion NASDAQ shares, better than expected, but obviously poor in general. Early action looked horrible, but the market ended up filling both yesterday's gap (by reaching down) and today's gap (by reaching back up) before closing about even.
Net ticks: -4.5 ticks.
As usual, let's start by taking a look at the ES and NQ with our market directional lines, VWAP, and Comber on the 5-minute chart from today's session:
ES:
My ES triggered long at 1603.50 at A and stopped for 7 ticks:
NQ:
Just a reminder that we use half points for ticks on the NQ and not the quarter point measurement that the exchanges switched to in recent years. This allows us to use 6 ticks as a key target as we do on the other contracts. It also keeps the value of a tick at $10, closer to the value of a tick on the other contracts.
Mark's call triggered long at A at 2896.00, hit first target for 6 ticks, and stopped the second half under the entry:
Forex Calls Recap for 6/28/13
A half-sized loser and a full-sized (bigger) winner to close out the week, month, and quarter. See GBPUSD section below.
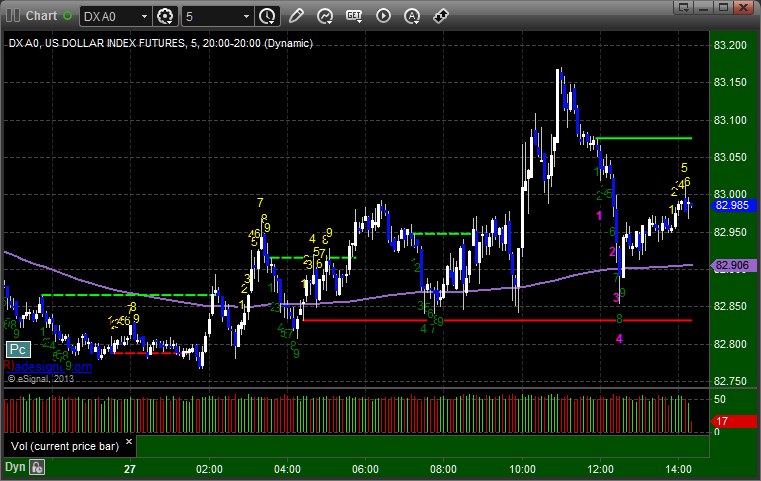
Here's a look at the US Dollar Index intraday with our market directional lines:
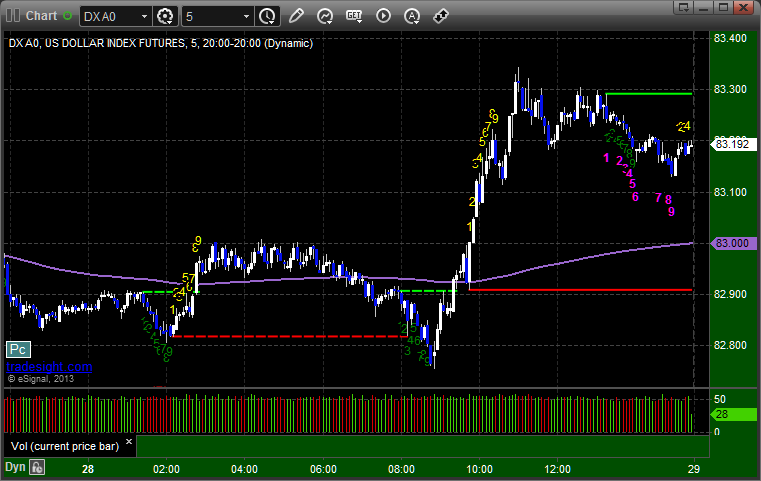
As usual on the Sunday report, we will look at the action from Thursday night/Friday, then look at the daily charts of all the pairs with the Seeker and Comber separately for the week ahead, and then glance at the US Dollar Index. There is, once again, nothing to declare on any of the daily charts as we have no patterns nearing key support/resistance and no approaching 13 buy or sell signals on the Seeker (or even Comber) tools. We are in limbo.
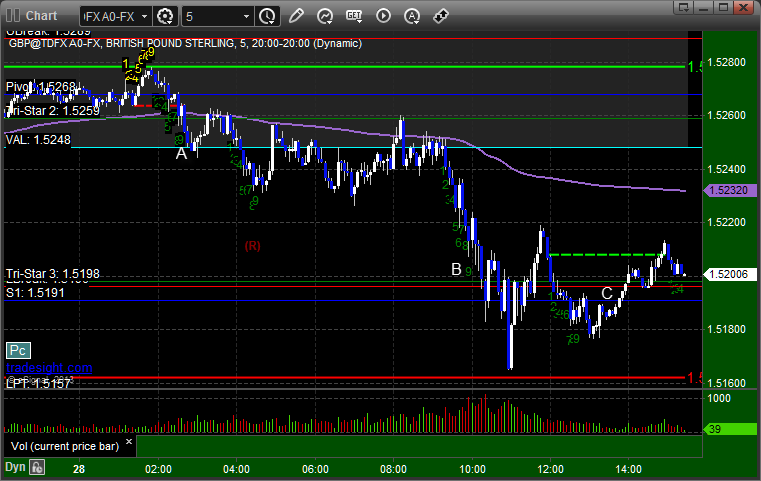
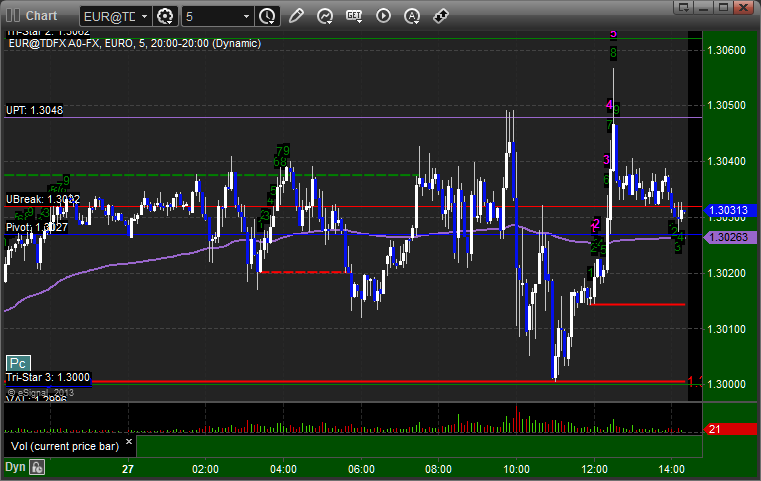
GBPUSD:
After a very early trigger (before this chart) triggered and stopped, we had a regular trigger at A that hit the first target at B, and we closed the final piece at C for end of week:
Forex Calls Recap for 6/28/13
A half-sized loser and a full-sized (bigger) winner to close out the week, month, and quarter. See GBPUSD section below.
Here's a look at the US Dollar Index intraday with our market directional lines:
As usual on the Sunday report, we will look at the action from Thursday night/Friday, then look at the daily charts of all the pairs with the Seeker and Comber separately for the week ahead, and then glance at the US Dollar Index. There is, once again, nothing to declare on any of the daily charts as we have no patterns nearing key support/resistance and no approaching 13 buy or sell signals on the Seeker (or even Comber) tools. We are in limbo.
GBPUSD:
After a very early trigger (before this chart) triggered and stopped, we had a regular trigger at A that hit the first target at B, and we closed the final piece at C for end of week:
Stock Picks Recap for 6/27/13
With each stock's recap, we will include a (with market support) or (without market support) tag, designating whether the trade triggered with or without market directional support at the time. Anything in the first five minutes will be considered WITHOUT market support because market direction cannot be determined that early. ETF calls do not require market support, and are thus either winners or losers.
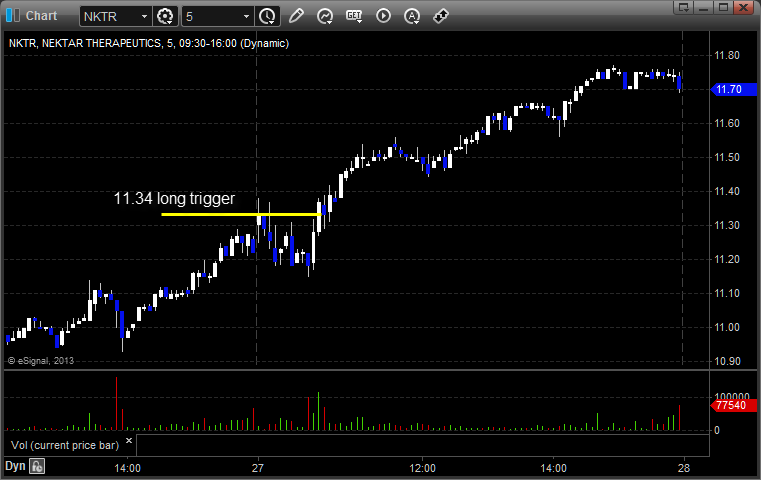
From the report, NKTR triggered long (with market support) and worked:
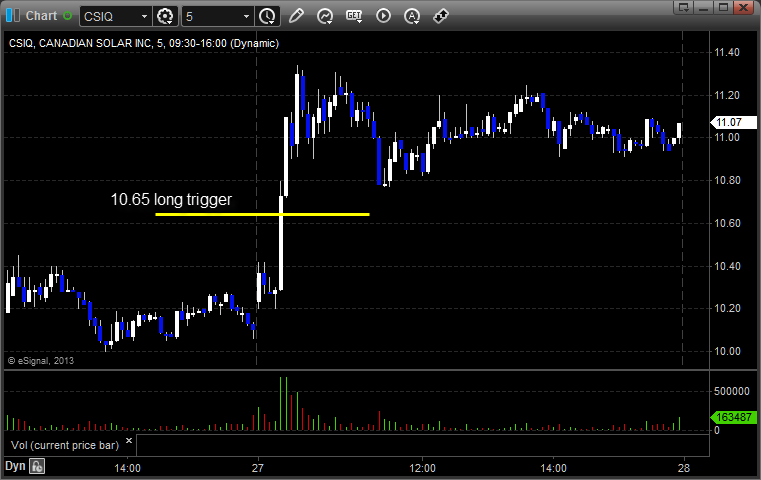
CSIQ triggered long (with market support) and worked:
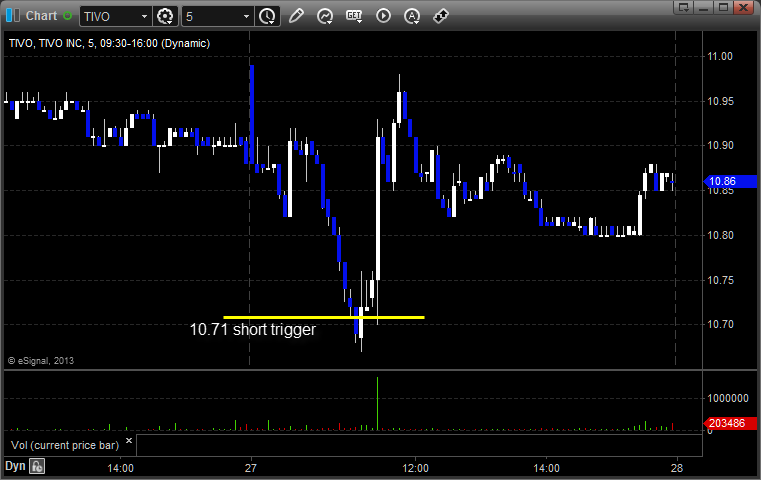
TIVO triggered short (with market support) and didn't work:
From the Messenger/Tradesight_st Twitter Feed, Rich's FAS triggered short (ETF, so no market support needed) and didn't work:

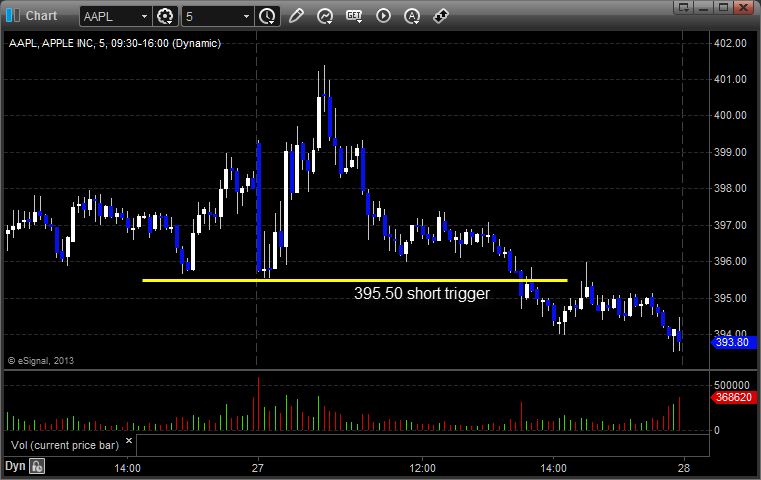
His AAPL triggered short (with market support) and worked enough for a partial:
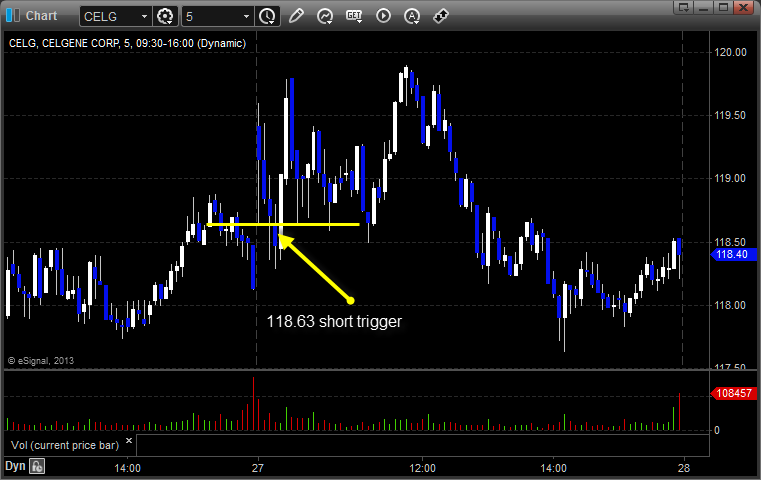
His CELG triggered short (without market support0 and didn't work:
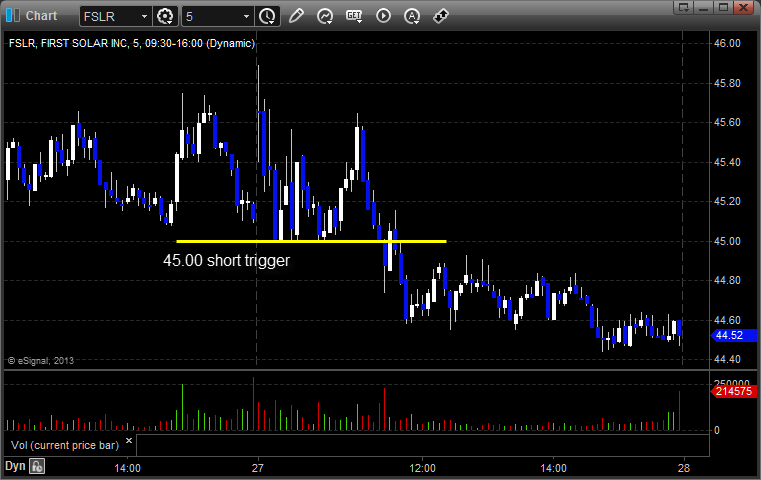
FSLR triggered short (with market support) and worked:
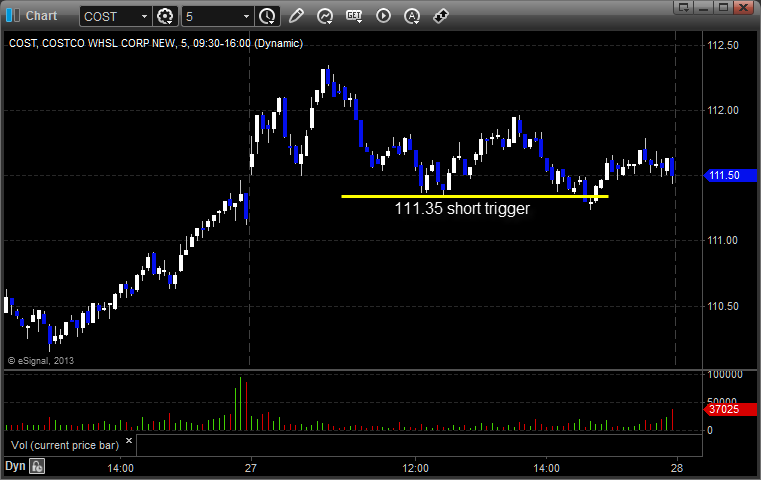
COST triggered short (with market support) and didn't work:
In total, that's 7 trades triggering with market support, 4 of them worked, 3 did not.
Futures Calls Recap for 6/27/13
Had a small winner that looked set up nice but was stalling after about 10 minutes in light volume, so I closed it out at a small gain. See ES below. Might not be any calls Friday due to end of month, quarter, and half on a Friday in the summer. Next week should be interesting too.
Net ticks: +2 ticks.
As usual, let's start by taking a look at the ES and NQ with our market directional lines, VWAP, and Comber on the 5-minute chart from today's session:
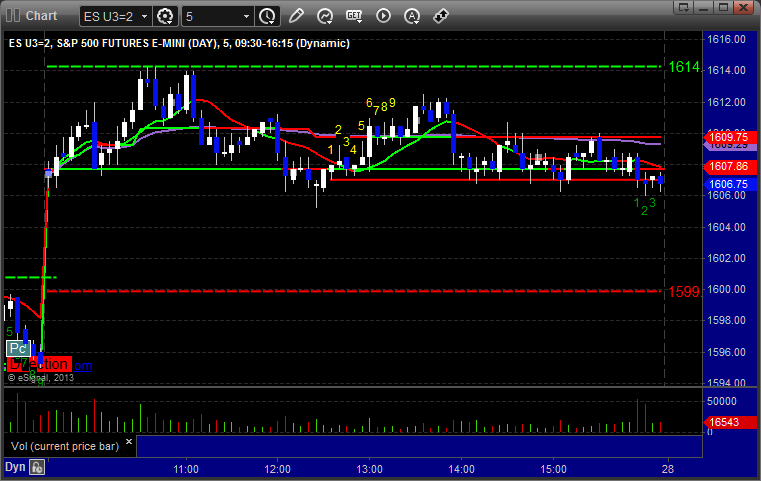
ES:
Set the UPT twice in the opening bars and then triggered long at A at 1608.50. After about ten minutes, the activity seemed weak, volume was light, and the gap concerned me, so I closed it for two ticks. It ended up working:
Futures Calls Recap for 6/27/13
Had a small winner that looked set up nice but was stalling after about 10 minutes in light volume, so I closed it out at a small gain. See ES below. Might not be any calls Friday due to end of month, quarter, and half on a Friday in the summer. Next week should be interesting too.
Net ticks: +2 ticks.
As usual, let's start by taking a look at the ES and NQ with our market directional lines, VWAP, and Comber on the 5-minute chart from today's session:
ES:
Set the UPT twice in the opening bars and then triggered long at A at 1608.50. After about ten minutes, the activity seemed weak, volume was light, and the gap concerned me, so I closed it for two ticks. It ended up working:
Forex Calls Recap for 6/27/13
Stopped out of the second half of the prior day's EURUSD trade in the money, and then nothing triggered new. EURUSD was so stuck in the Value Area that the only thing you see for the background of the chart is the shaded area. See that section below.
Here's a look at the US Dollar Index intraday with our market directional lines:
EURUSD:
Stopped out of the second half of the prior day's play over the Pivot. 60 pips of range, all in the Value Area: