Tradesight 2012 End of Year Market Summary
As usual, we wrap up the year with a report about the markets and our trading for the last twelve months (here's a link to last year's report). Having been involved in and trading the markets now for over 20 years, I have to say that this year was unique in many ways, most of them not really positive for trading. Volume and activity were way down in all three asset classes that we trade (stocks, futures, and Forex). Without action, it really takes a concentrated effort to get and stay green. Overall, I would say again that our flagship stock report performed admirably as usual, while Forex had a decent start to the year but really suffered as ranges dipped to extended historic lows. The futures also suffered from lack of range and volume, especially in the second half of the year.
I make the case often that I believe professional traders should be open to trading anything because things go through cycles, and this was certainly a year that would have challenged anyone trading only Forex or futures in my opinion, although the stock stuff had enough moments to make it the easier asset class to trade. We'll get into some numbers at the back end, but let's first look at what the market gave us.
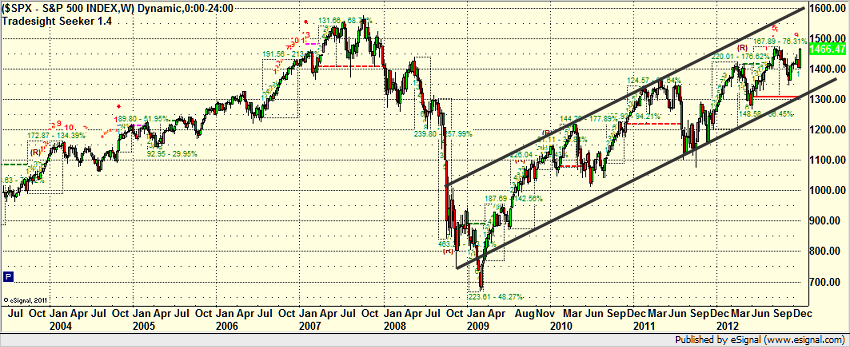
The S&P 500 came into the year at 1257.60 and closed at 1426.19 after once again spending a lot of time on the critical ES level of 1312.50 (an old Tradesight joke from the last decade, as is the EURUSD at 1.2737). That's a 13% gain on the S&P for the year, which is certainly nothing to sneeze at. Here's the chart, though, which shows that we didn't have nearly the up and down swings that we are used to:
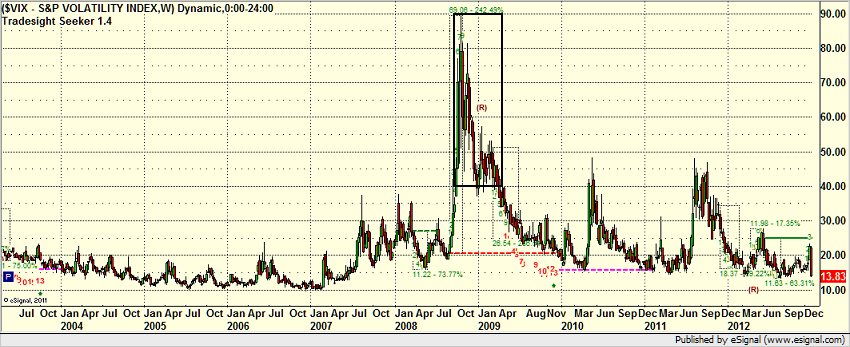
And you can see that also by looking at the Volatility Index (VIX) for the year, which, for the first time in the last 5 years, never really got a spike over 40, which creates the pullbacks:
Even with all of the Fiscal Cliff concern, there was never really a drop in the market, and we went through an election with no issues. Also, I'm writing this a few days into 2013, and the market is up strong to start the year as well.
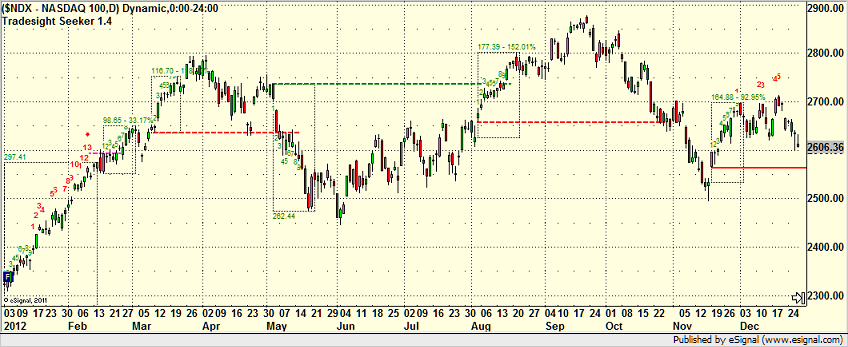
The NASDAQ came into the year at 2277 and closed at 2660, a 383 point gain, or 16.8%. Again, nothing to sneeze at for investors:
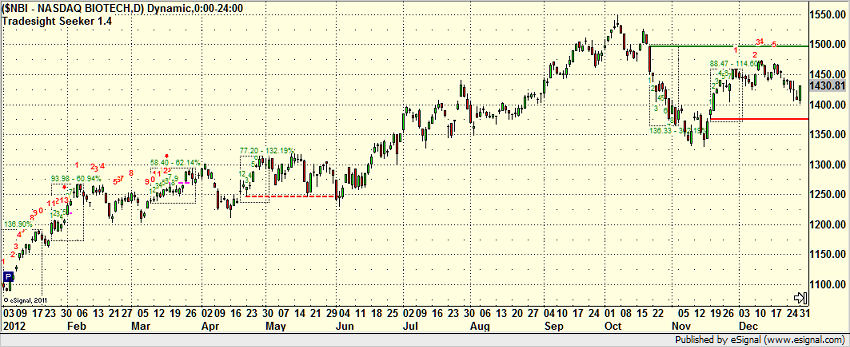
If you break out the two key tech sectors, the Semiconductors and Biotechs, you can see that the Bios had a decent year:
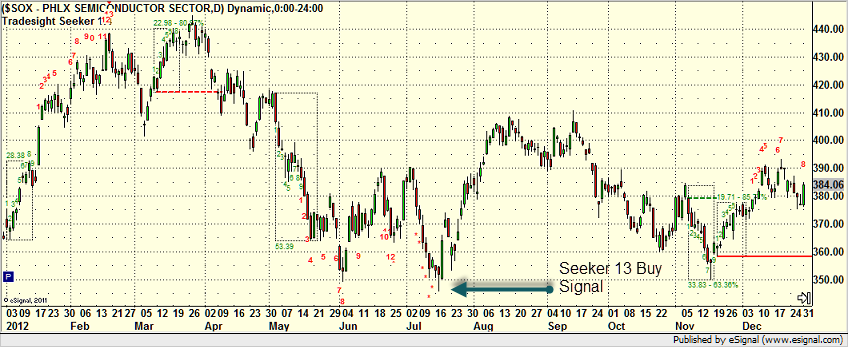
However, the Semis were actually down for the year at the midpoint (note that the low bar of the year is a 13 buy signal from our Seeker tool:
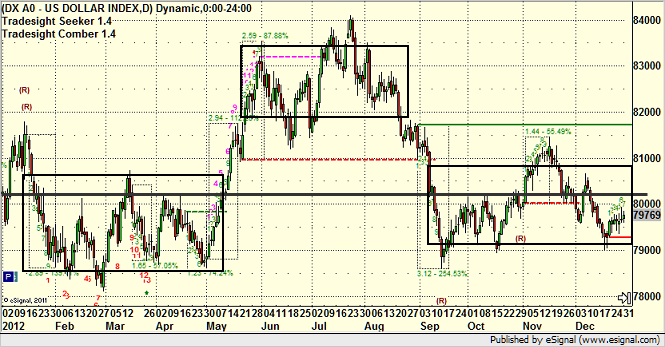
I've already written up a separate Forex end of year report, but for Forex traders, ranges were the problem, and overall movement wasn't great either. Here's the US Dollar Index, which basically traded flat in three boxes for most of the year:
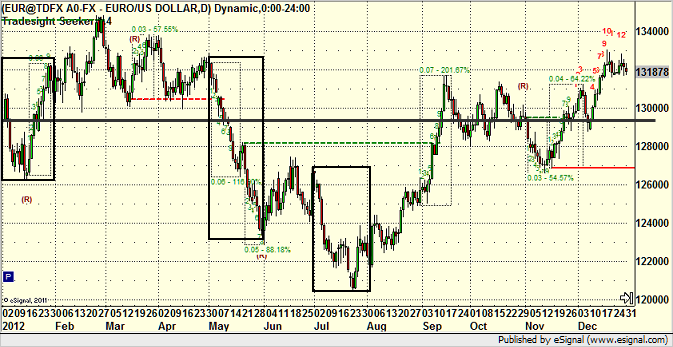
The EURUSD was in a smaller range than normal for annual numbers:
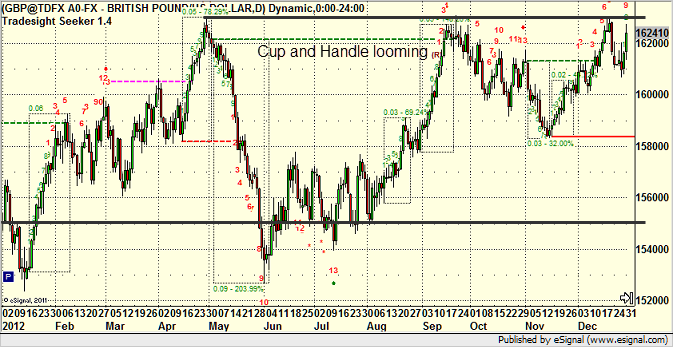
As was the GBPUSD:
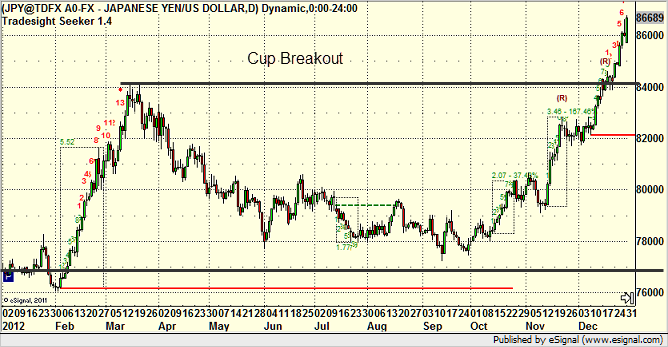
The USDJPY had impossibly narrow intraday moves, but on the whole, the US Dollar strengthened against the JPY for the year (even though it slightly weakened against other currencies):
While 2011 saw the nuclear disaster in Japan (and the USDJPY has been pegged and tough to trade ever since), the last two years saw all of the issues out of Europe, including the failed austerity actions (failed meaning that the moves to cut spending has only raised unemployment and done nothing to help their respective economies), the potential (still looming) fracture of the Euro, and the self-created Fiscal Cliff mess that Congress set up for post-2012 election over a year ago.
All of those individuals added up to less economic activity, less movement of money, and a lot of uncertainty about taxes and where money was headed. It has also been a much stricter lending environment as the banks are still reeling from the 2008 debacle, and that hasn't helped. Add it all up, and all of the markets were somewhat stuck in place.
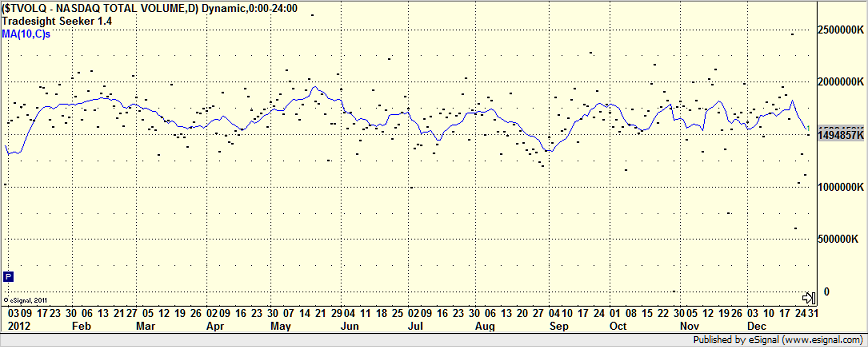
Volume in the stock market is important for trading, and 2012 set an interesting record from the last FIFTEEN YEARS (this fact is extremely important but will be lost on many people). 2012 was the first time in 15 years that NASDAQ volume never saw a 10-day moving average get over 2 billion shares. Our general rule for good trading has always been that the 2 billion share "average" day or better volume is needed for the better sessions. We did have some days over 2 billion shares, but not many, and the 10 day moving average never got over that number, as you can see here:
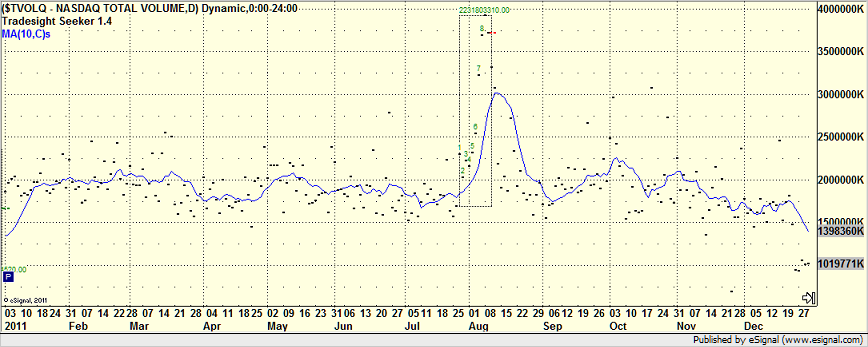
Compare that to even 2011, where the moving average spent almost half of the year above that level:
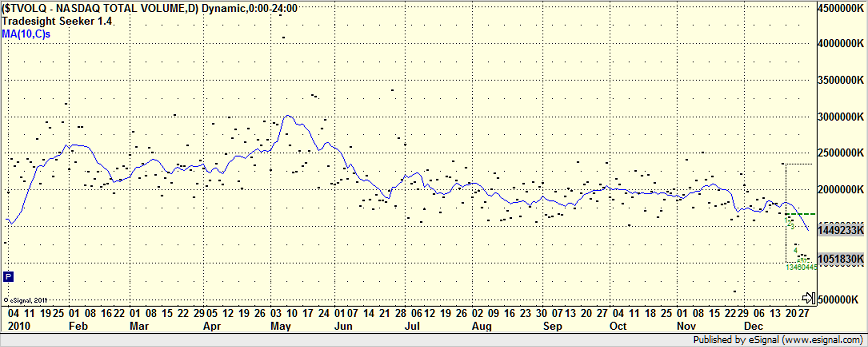
Or 2010, which is a year that is much more typical of what we have seen for a long time, where volume is well over 2 billion shares most of the year, except maybe the summer doldrums of August and the Holiday season of December:
Easily, the single biggest contributor to the trading environment is the lack of volume, which means everything is moving less, and following through LESS, which is the most important point.
Another contributor to this, though, was the amount of "fast" money (i.e. daytrading money) that got "stuck" in Facebook on the IPO:
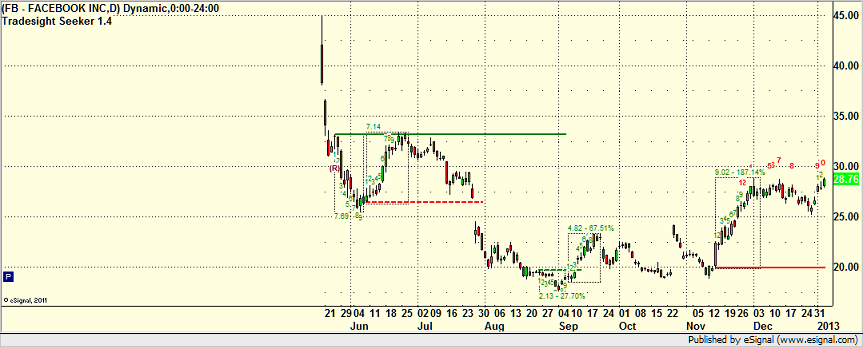
Again, one of the most poorly handled (except for for people working at Goldman) IPOs in history, and if you line up the biggest drop in market volume, it comes with the day that Facebook went public.
This was not a year that needed that to happen.
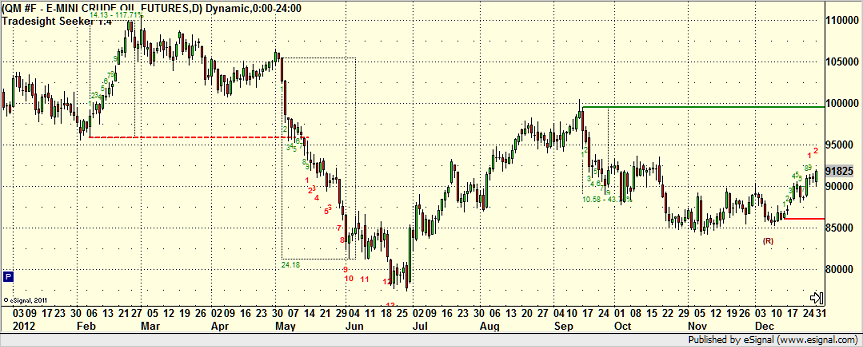
Here's a look at oil, which declined for the year (and despite what some people might try to say, is down quite a bit from what we've seen on average the last few years):
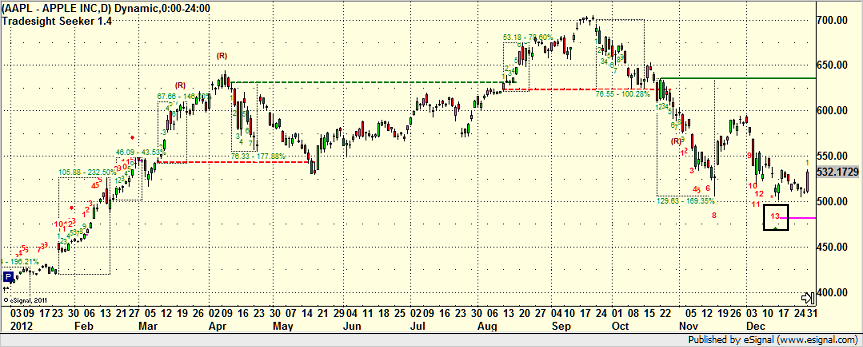
There are also some interesting points to be made about some of the bigger tech stocks that we trade frequently, such as AAPL, which had a strong early part of the year but sold off sharply late. It came into the year just over $400 and almost broke $500 in the December plunge, although you'll notice that the Seeker again gave a 13 buy signal on the day that might have tried to break $500, and that has been the low so far (it is behaving like it will break it soon):
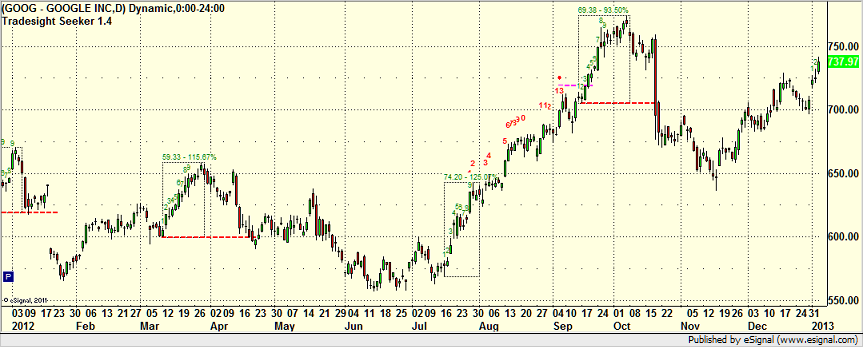
GOOG, on the other hand, had a slower start to the year, but clearly came on stronger in the second half as it continues to see better Android sales than iStuff sales, especially in other countries:
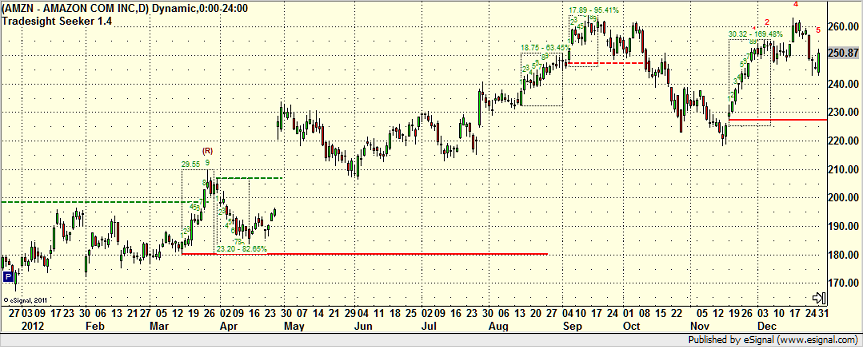
AMZN, another favorite trading stock of ours, had a strong year and held it:
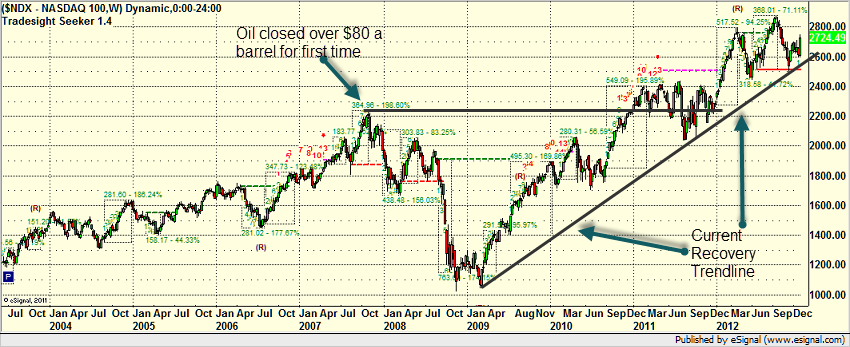
And finally, let's put a few more things into longer term perspective. Here's the 8-year chart of the NDX, which now makes the 2008 banking collapse look like a blip, but I've marked it up with the high in 2007 when oil first closed over $80 (when Tradesight predicted bad things were coming) and the recent post-stimulus trendline, which started in early 2009 and tested as recently as September. This is a line we're going to want to watch if the looming "battle" in 60 days leads to too much in spending cuts ("austerity"), which will most likely put the recovery on hold and hurt the markets:
Here's the S&P over the same period, which hasn't yet reclaimed the highs of 2007 prior to the collapse, but is clearly in a "channel" that we can monitor:

And finally, here's the VIX over 8 years. You can't do a year-end report without showing the importance of the VIX or Rich will get mad:

Remember that the VIX over 40 usually means panic is setting in and a reversal is ready to happen. The spike to 90 and the period of 3 months that the VIX basically held over 40 in late 2008 on the collapse was historic, and at the time, what we said was that when it finally retreated under 40 (which happened in March 2009), that would a long term bottom in the markets. So far, that has proven extremely accurate, but it was also predicated on a lot of good economic decisions coming out of Washington. And certainly, we've made the money we wanted on that move. I'm not sure based on the actions out of Washington over the last 18 months or so that we can assume that good decisions will continue to be made, which can still derail the train. Keep in mind that the downgrade of US debt, if you read the report, was not because of our debt ratio or growth rate. It was because of a concern that Washington was suddenly so dysfunctional that it wouldn't do the things that it has always done to show that the United States is the responsible leading financial player in the world (i.e. always pay our bills and don't pretend that we wouldn't).
With the Fiscal Cliff at least behind us (and if they had just done it back six months ago, things would have been a lot better the last six months for trading), we're already seeing better volume and movement in the opening days of 2013. Unfortunately, they couldn't get more than a 2 month extension on the sequester, so the spending battle looms and lines up with the debt ceiling increase (again, the more you suggest that the United States might NOT increase the debt ceiling, therefore might NOT pay our existing bills), the more it hurts the economy. And, just like everything these days, my expectation has to be (in terms of guiding traders) that Washington will take it right up to the last day again because they can't put the country first. So, we will see how long the "better trading" environment that we are seeing signs of lasts before the market gets crippled again wondering how that will be resolved. If you want a better trading environment, call you Congressperson and let him/her know that they better put together a deal that lasts for several years so the market and the economy has certainty. Believe me, that's more important that the DETAILS of the deal. We can't keep going through this every 12 months.
So, in the context of that market environment during 2012, I think it is clear that stock trading was the better asset class. Every year, we have one, maybe two months that are losing months in Forex as ranges come and go. This was the first year (in the seven that we've been doing Forex) that we had THREE months IN A ROW even that had losses. That's how bad ranges got.
Meanwhile, almost 70% of our stock trades that triggered with market support worked enough for a partial, which means that even though there were more than normal that didn't do much beyond the partial, you shouldn't lose money on those 70% of trades. And we still had plenty of big winners, all of which you can track daily in the Market Blog even if you aren't a subscriber.
The futures were the middle ground. They still behaved technically, but I see a lot more false starts where a nice setups sweeps once and stops and then works at least to the partial the second time than we have seen in prior years. And that just creates a lot of whiplash and net-nothing days.
I do expect ranges to come back in Forex, and as we see stock market volume improve, Futures will see better action. Stocks, while fairly consistent, will get even better, with more trades following through, with market volume.
So, even though Santa has already come and gone for 2012, if you are asking for anything, ask for volume in the markets. Or better yet, don't ask him, ask someone in Washington DC, as they are really the ones that can make it happen. But no, the stories you here about "regulation killed the Forex market forever" and "High Frequency Trading makes it impossible for retail traders to make money" are all nonsense. Economic activity will only grow over time on average.
Here's to a great 2013, and thanks for being the best subscribers in the world.
Tradesight Forex End of 2012 Summary and Results
Let's start with the results for the year, and then we will layer how the market behaved on top of it. First, let's clarify that the trading system that we teach in our courses is something that you can apply and use to develop many more trades than just the ones that we call each day. Using the system, we try to target 50-60% winning trades, and we keep our losses very tight (25 pips max) with no exceptions. The system works better when the pairs are trading good average daily ranges, and we certainly saw a drop off in ranges in 2012, especially in the second half of the year. In the prior year, 2011, we netted almost 3100 pips for the year with about a 51% win rate. 2012 was not that year, but it was still respectable, and certainly, I'd take the average of the two years each year and be happy.
In 2012, we had 337 triggers off of our main trade calls (again, if you have taken the courses, you can find much more to do, including trading some of the pairs beyond the EURUSD and GBPUSD, using Value Areas, etc.). 160 were winners. That's at 47.5% win ratio, which is slightly below our targeted range of 50-60%, but if there was going to be a year where that happened, it would be 2012 with the bad ranges. I haven't seen anything like that since 2007.
Separately, these results don't account for the fact that we told our subscribers to go half size late in the summer as range dropped. This is something that we typically do around August if the summer doldrums present themselves, but we move back to full size shortly after when ranges resume. This year, since ranges didn't resume, we are still half size at the end of the year. The net pip gains for the calls was exactly 700 pips, and again, that doesn't account for the fact that the last four months of the year were half size. Three of those months gave us negative results (although December was a return to gains with 185 pips locked in).
If you take the 12 months in order, here were the pip gains or losses: +330, +70, +100, +125, +10, +275, +150, +100, -130, -100, -45, and +185.
Every year has one losing month with our system, often during the summer doldrums. The Tradesight Forex service launched in 2005. A couple of the years since (including 2007, which was really slow), we saw two losing months, although never back to back. We had 3 months in a row here with net losses in 2012. That's how bad the market got.
Keep in mind, however, that even with those months, we had net gains for the year, and our system prevented major harm from being done as we keep our losses very tight. If you adjust the last four months to half size, the net gain was really +785 (might have been even bigger exception December was a decent month).
One other way to look at it, and I'm happy to see this because it fits with the "system" that we want, is that most of those 700 pips were locked in during the first six months of the year, and then the last six months, which were as narrow as I've seen, were basically a wash. It's hard to have a problem with a trading system that essentially gives you no gain or loss when the worst environment for the system presents itself.
You can browse the net results of each month by clicking here and scrolling down.
So let's put the year into perspective with some charts, but we will keep it to a few as we also have a separate end of year report for all markets.
Let's start by taking a look at the most commonly traded pair out there, the EURUSD. I've drawn a flat black line on each of these charts from the start of the year so you can see if we net gained or lost:

What you'll notice in that chart is that even though it traded 1400 pips from high to low, which sounds like a lot, most of the moves were in the boxes that I've drawn, where we made good money. Too much of the year was spent in flat action, and we only ended up 200 pips higher than we started the year. I should also point out the the prior year saw 2000 pips of range in the EURUSD, but we saw a full move up the 2000 pips and then back, which is a lot more movement.
Here's the GBPUSD, which has a nice cup and handle formed for a potential breakout in 2013:

Here we saw only 1000 pips of range, and it still had the same few months with the best action. Note that ALL THREE Seeker 13 signals during the year (1 buy, 2 sells) were very timely. But here, the net gain for the year was 650 pips.
Keep in mind that both the EURUSD and GBPUSD rose during the year, which is negative for the US Dollar. However, the USDJPY told the opposite tale, breaking out of a nice cup formation:

So against the JPY, the US Dollar got much stronger. Unfortunately, even with that action, the daily ranges in the USDJPY have been crippling from a trading perspective since the nuclear incident in 2011.
So the net of all of that is that the US Dollar itself barely changed for the whole year of 2012. Here's the index:

Notice that we did move up mid-year, then came back a bit and went flat as the Fiscal Cliff situation approached. The election had little to no impact.
I've drawn three boxes, however, that show just how stuck and boring the US Dollar was for big sections of the year.
In the end, it wasn't the type of year that we've seen in the past, but you can't expect every year to be exciting. No, it doesn't mean that the Forex market is dying. Too many people blame regulation for killing the Forex market, but my opinion is that that plays a tiny sliver of a role. We saw ranges dip in 2007 for a while, but they were ridiculously big in 2008 with the banking collapse and great in the years after (until 2012). With Japan's currency seemingly being controlled post-nuclear incident, Europe in trouble, the world in a SPENDING recession (which aren't helped by austerity moves), and the US creating a useless (I'll go ahead and say it...complete stupid and unnecessary) amount of uncertainty with the Fiscal Cliff, there just wasn't a lot of currency moving. It will move again, but our system is designed to protect you in the slow periods (obviously, if they last for years, it would be bad), which it did. Here's to 2013.
Tradesight Forex End of 2012 Summary and Results
Let's start with the results for the year, and then we will layer how the market behaved on top of it. First, let's clarify that the trading system that we teach in our courses is something that you can apply and use to develop many more trades than just the ones that we call each day. Using the system, we try to target 50-60% winning trades, and we keep our losses very tight (25 pips max) with no exceptions. The system works better when the pairs are trading good average daily ranges, and we certainly saw a drop off in ranges in 2012, especially in the second half of the year. In the prior year, 2011, we netted almost 3100 pips for the year with about a 51% win rate. 2012 was not that year, but it was still respectable, and certainly, I'd take the average of the two years each year and be happy.
In 2012, we had 337 triggers off of our main trade calls (again, if you have taken the courses, you can find much more to do, including trading some of the pairs beyond the EURUSD and GBPUSD, using Value Areas, etc.). 160 were winners. That's at 47.5% win ratio, which is slightly below our targeted range of 50-60%, but if there was going to be a year where that happened, it would be 2012 with the bad ranges. I haven't seen anything like that since 2007.
Separately, these results don't account for the fact that we told our subscribers to go half size late in the summer as range dropped. This is something that we typically do around August if the summer doldrums present themselves, but we move back to full size shortly after when ranges resume. This year, since ranges didn't resume, we are still half size at the end of the year. The net pip gains for the calls was exactly 700 pips, and again, that doesn't account for the fact that the last four months of the year were half size. Three of those months gave us negative results (although December was a return to gains with 185 pips locked in).
If you take the 12 months in order, here were the pip gains or losses: +330, +70, +100, +125, +10, +275, +150, +100, -130, -100, -45, and +185.
Every year has one losing month with our system, often during the summer doldrums. The Tradesight Forex service launched in 2005. A couple of the years since (including 2007, which was really slow), we saw two losing months, although never back to back. We had 3 months in a row here with net losses in 2012. That's how bad the market got.
Keep in mind, however, that even with those months, we had net gains for the year, and our system prevented major harm from being done as we keep our losses very tight. If you adjust the last four months to half size, the net gain was really +785 (might have been even bigger exception December was a decent month).
One other way to look at it, and I'm happy to see this because it fits with the "system" that we want, is that most of those 700 pips were locked in during the first six months of the year, and then the last six months, which were as narrow as I've seen, were basically a wash. It's hard to have a problem with a trading system that essentially gives you no gain or loss when the worst environment for the system presents itself.
You can browse the net results of each month by clicking here and scrolling down.
So let's put the year into perspective with some charts, but we will keep it to a few as we also have a separate end of year report for all markets.
Let's start by taking a look at the most commonly traded pair out there, the EURUSD. I've drawn a flat black line on each of these charts from the start of the year so you can see if we net gained or lost:

What you'll notice in that chart is that even though it traded 1400 pips from high to low, which sounds like a lot, most of the moves were in the boxes that I've drawn, where we made good money. Too much of the year was spent in flat action, and we only ended up 200 pips higher than we started the year. I should also point out the the prior year saw 2000 pips of range in the EURUSD, but we saw a full move up the 2000 pips and then back, which is a lot more movement.
Here's the GBPUSD, which has a nice cup and handle formed for a potential breakout in 2013:

Here we saw only 1000 pips of range, and it still had the same few months with the best action. Note that ALL THREE Seeker 13 signals during the year (1 buy, 2 sells) were very timely. But here, the net gain for the year was 650 pips.
Keep in mind that both the EURUSD and GBPUSD rose during the year, which is negative for the US Dollar. However, the USDJPY told the opposite tale, breaking out of a nice cup formation:

So against the JPY, the US Dollar got much stronger. Unfortunately, even with that action, the daily ranges in the USDJPY have been crippling from a trading perspective since the nuclear incident in 2011.
So the net of all of that is that the US Dollar itself barely changed for the whole year of 2012. Here's the index:

Notice that we did move up mid-year, then came back a bit and went flat as the Fiscal Cliff situation approached. The election had little to no impact.
I've drawn three boxes, however, that show just how stuck and boring the US Dollar was for big sections of the year.
In the end, it wasn't the type of year that we've seen in the past, but you can't expect every year to be exciting. No, it doesn't mean that the Forex market is dying. Too many people blame regulation for killing the Forex market, but my opinion is that that plays a tiny sliver of a role. We saw ranges dip in 2007 for a while, but they were ridiculously big in 2008 with the banking collapse and great in the years after (until 2012). With Japan's currency seemingly being controlled post-nuclear incident, Europe in trouble, the world in a SPENDING recession (which aren't helped by austerity moves), and the US creating a useless (I'll go ahead and say it...complete stupid and unnecessary) amount of uncertainty with the Fiscal Cliff, there just wasn't a lot of currency moving. It will move again, but our system is designed to protect you in the slow periods (obviously, if they last for years, it would be bad), which it did. Here's to 2013.
Tradesight December 2012 Forex Results
Before we get to December’s numbers, here is a short reminder of the results from November. The full report from November can be found here and you can get the last several months in a row vertically by clicking here and scrolling down.
Tradesight Pip Results for November 2012
Number of trades: 21
Number of losers: 13
Winning percentage: 38%
Worst losing streak: 4 in a row (end of the month)
Net pips: -45
Reminder: Here are the rules.
1) Calls made in the calendar month count. In other words, a call made on August 31 that triggered the morning of September 1 is not part of September. Calls made on Thursday, September 30 that triggered between then and the morning of October 1 ARE part of September.
2) Trades that triggered before 8 pm EST / 5 pm PST (i.e. pre Asia) and NEVER gave you a chance to re-enter are NOT counted. Everything else is counted equally.
3) All trades are broken into two pieces, with the assumption that one half is sold at the first target and one half is sold at the final exit. These are then averaged. So if we made 40 pips on one half and 60 on the second, that’s a 50-pip winner. If we made 40 pips on one half, never adjusted our stop, and the second half stopped for the 25 pip loser, then that’s a 7 pip winner (15 divided by 2 is 7.5, and I rounded down).
4) Pure losers (trades that just stop out) are considered 25 pip losers. In some cases, this can be a few more or a few less, but it should average right in there, so instead of making it complicated, I count them as 25 pips.
5) Trade re-entries are valid if a trade stops except between 3 am EST and 9 am EST (when I’m sleeping). So in other words, even if you are awake in those hours and you could have re-entered, I’m only counting things that I would have done. This is important because otherwise the implication is that you need to be awake 24/6. Triggers that occur right on the Big Three news announcements each month don’t count as you shouldn’t have orders in that close at that time.
You can go through the reports and compare the breakdown that I give as each trade is reviewed.
Tradesight Pip Results for December 2012
Number of trades: 25
Number of losers: 9
Winning percentage: 64%
Worst losing streak: 3 in a row (during the Holiday week)
Net pips: +185
Although we only count the raw numbers, we continue to be at half size now for the last four months due to the horrible Forex ranges (which may be improving finally). This was a much improved month that wiped out much of the losses of the last three months while still being half size. Our winning percentage jumped considerably, as you can see in the numbers above. 64% is well above the expectation for winning trades, and it certainly makes for better months. We saw slight improvement in ranges in all of the pairs from prior months (EURUSD back up to 100 pips for the month or so, an improvement on November's 80 pips). With the fiscal cliff deal done (although another dumb battle looming), hopefully ranges will continue to improve, and we can get back to full size in early 2013 finally.
I have a separate end of year summary report for Forex going up behind this one, so I'll just leave this as is.
Tradesight December 2012 Futures Results
Before we get to December’s numbers, here is a short reminder of the results from November. The full report from November can be found here.
Tradesight Tick Results for November 2012
Number of trades: 26
Number of losers: 16
Winning percentage: 38.4%
Net ticks: -27 ticks
Reminder: Here are the rules.
1) Totals for the month are based on trades that occurred on trading days in the calendar month.
2) Trades are based on the calls in the Messenger exactly as we call them and manage them and do not count everything you could have done from taking our courses and using our tools.
3) All trades are broken into two pieces, with the assumption that one half is sold at the first target and one half is sold at the final exit. These are then averaged. So if we made 6 ticks on one half and 12 on the second, that’s a 9-tick winner.
4) Pure losers (trades that just stop out) are considered 7 tick losers. We don’t risk more than that in the Messenger calls.
You can go through the reports and compare the breakdown that I give as each trade is reviewed.
Tradesight Tick Results for December 2012
Number of trades: 25
Number of losers: 10
Winning percentage: 60.0%
Net ticks: +9.5 ticks
An interesting end to the year. We didn't do any calls in the last week with the Holidays, half days, and the usually light end of year volume. Therefore, we only had 25 calls for the month, which is much less than usual. Ranges in the market were mostly light early on, and while the stock market has been interesting, the futures market remains a little bit contained, although certainly, December was better than November (ignoring the last week). We're still seeing too many cases where nice setups will sweep once before going and working the second time, and that brings down the net results.
We don't have an end of year summary report for the futures calls since we didn't start tracking the results until June. We will have one (like Forex has had for years) next year. You can view prior months by clicking here and scrolling through them all.
Stock Picks Recap for 1/4/13
With each stock's recap, we will include a (with market support) or (without market support) tag, designating whether the trade triggered with or without market directional support at the time. Anything in the first five minutes will be considered WITHOUT market support because market direction cannot be determined that early. ETF calls do not require market support, and are thus either winners or losers.
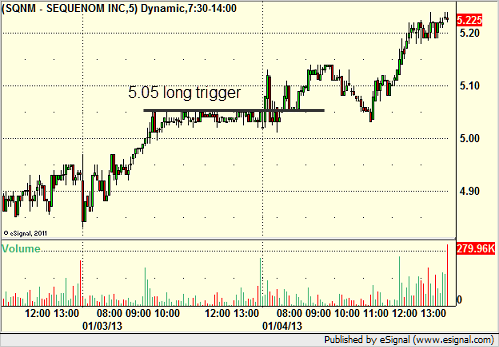
From the report, SQNM triggered long (without market support due to opening 5 minutes) and worked:
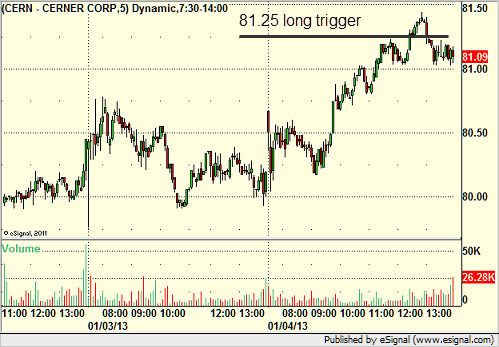
CERN triggered long (with market support) and didn't work quite enough for a partial (although we sold it in the room in the money):
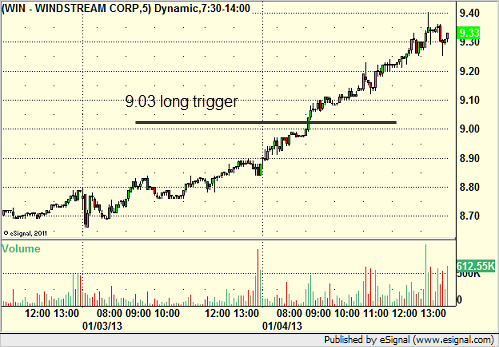
WIN triggered long (with market support) and worked:
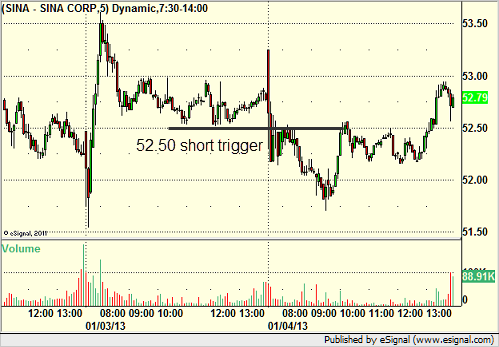
From the Messenger/Tradesight_st Twitter Feed, Rich's SINA triggered short (without market support due to opening 5 minutes) and worked:
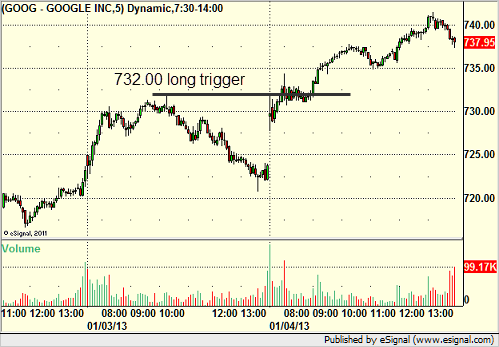
His GOOG triggered long (with market support) and worked:
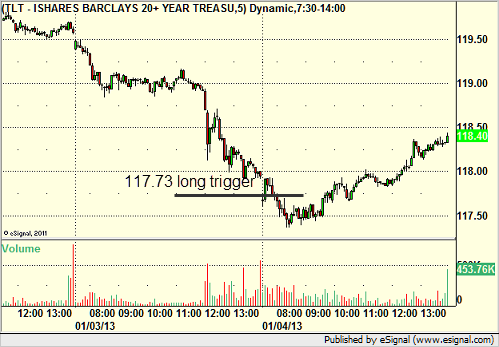
TLT triggered long (ETF, so no market support needed) and didn't work, although it worked later on the retrigger, but we only count the first one:
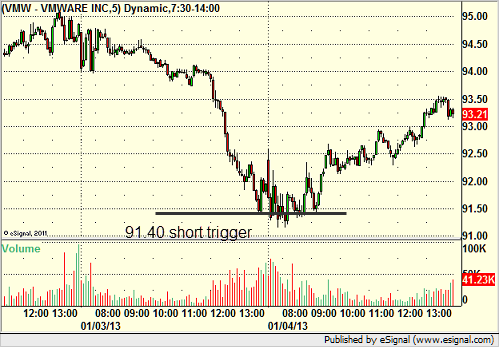
Rich's VMW triggered short (with market support for a moment) and didn't work:
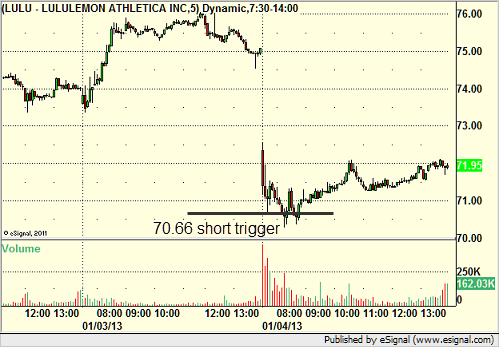
His LULU triggered short (with market support) and worked enough for a partial:
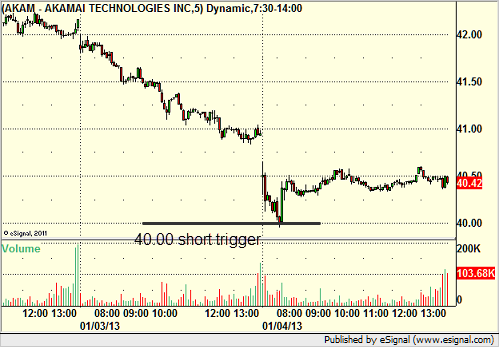
His AKAM triggered short (with market support) and didn't work:
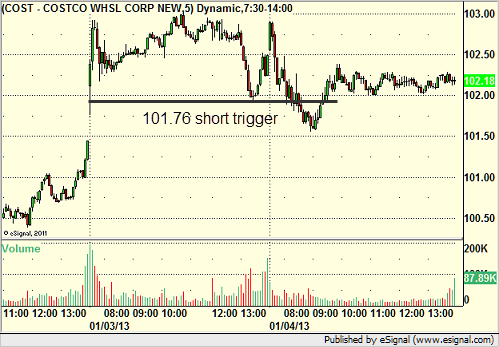
COST triggered short (without market support) and didn't work:
In total, that's 7 trades triggering with market support, 3 of them worked, 4 did not, although we had several calls that triggered cleanly out of the gate (like SQNM) that worked.
Stock Picks Recap for 1/4/13
With each stock's recap, we will include a (with market support) or (without market support) tag, designating whether the trade triggered with or without market directional support at the time. Anything in the first five minutes will be considered WITHOUT market support because market direction cannot be determined that early. ETF calls do not require market support, and are thus either winners or losers.
From the report, SQNM triggered long (without market support due to opening 5 minutes) and worked:

CERN triggered long (with market support) and didn't work quite enough for a partial (although we sold it in the room in the money):

WIN triggered long (with market support) and worked:

From the Messenger/Tradesight_st Twitter Feed, Rich's SINA triggered short (without market support due to opening 5 minutes) and worked:

His GOOG triggered long (with market support) and worked:

TLT triggered long (ETF, so no market support needed) and didn't work, although it worked later on the retrigger, but we only count the first one:

Rich's VMW triggered short (with market support for a moment) and didn't work:

His LULU triggered short (with market support) and worked enough for a partial:

His AKAM triggered short (with market support) and didn't work:

COST triggered short (without market support) and didn't work:

In total, that's 7 trades triggering with market support, 3 of them worked, 4 did not, although we had several calls that triggered cleanly out of the gate (like SQNM) that worked.
Futures Calls Recap for 1/4/13
A trigger and a stop out on the ES. See that section below. This was a very slow trading session with little consistent movement, although NASDAQ volume was 1.6 billion in the end. Always interesting when the NQ plays out the whole day under the Value Area, while the ES is mostly above it.
Net ticks: -7 ticks.
As usual, let's start by taking a look at the ES and NQ with our market directional lines, VWAP, and Comber on the 5-minute chart from today's session:
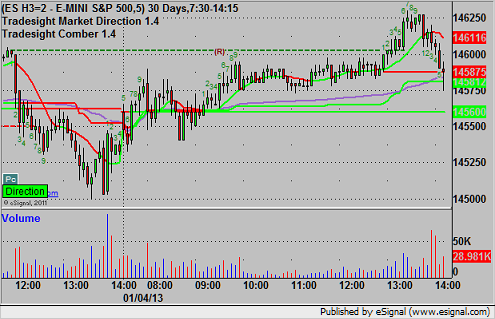
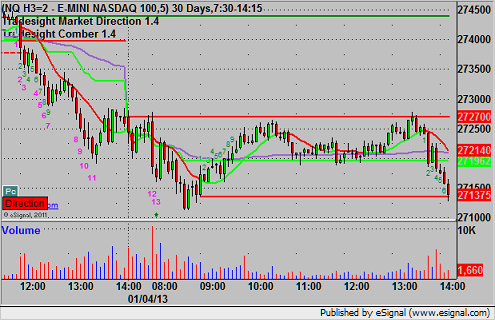
ES:
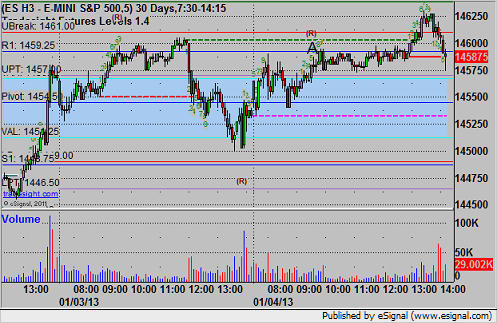
Mark's call triggered long at A at 1459.50 and stopped for 7 ticks:
Futures Calls Recap for 1/4/13
A trigger and a stop out on the ES. See that section below. This was a very slow trading session with little consistent movement, although NASDAQ volume was 1.6 billion in the end. Always interesting when the NQ plays out the whole day under the Value Area, while the ES is mostly above it.
Net ticks: -7 ticks.
As usual, let's start by taking a look at the ES and NQ with our market directional lines, VWAP, and Comber on the 5-minute chart from today's session:


ES:
Mark's call triggered long at A at 1459.50 and stopped for 7 ticks:

