Tradesight Market Preview for 12/12/12
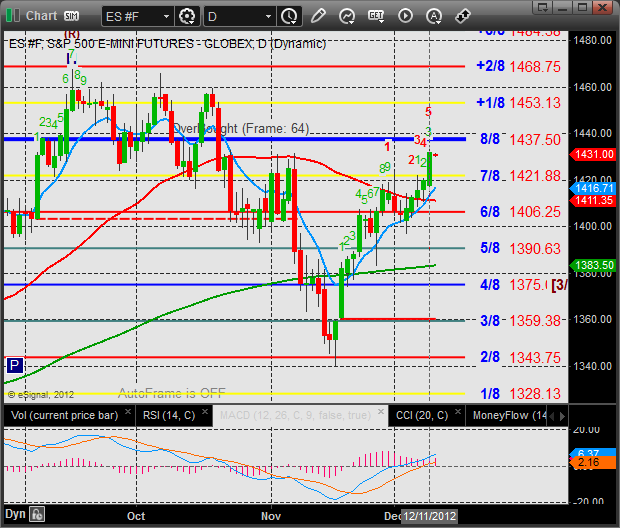
The ES expanded the rally’s range gaining 11 on the day. The MACD is above the zero line and carrying positive momentum. The next challenge for the bulls will be the 8/8 level at 1437.
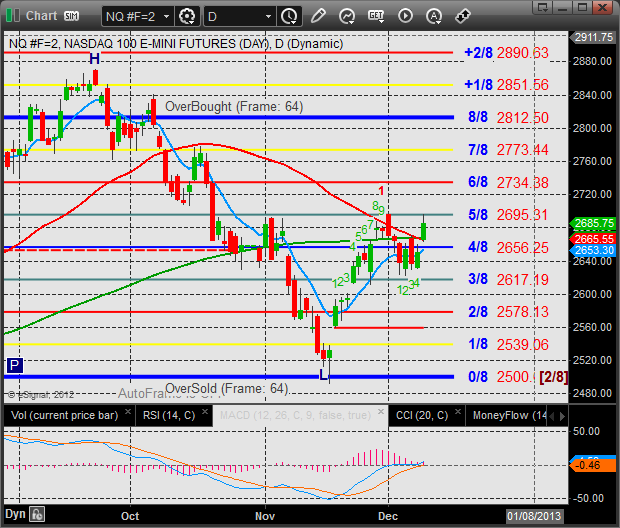
The NQ futures were higher by 35 on the day and finally may be losing their relative weakness. Pride is now back above all the major moving averages and the MACD is just above the zero line which opens the door for momentum. Expect that the 5/8 level will be very key since it terminated the bounce in November and was the origin of the exhaustion gap on 12/3.
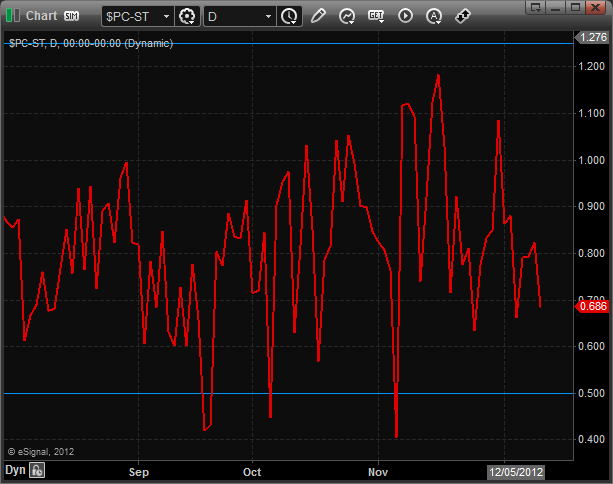
The total put/call ratio is still neutral:
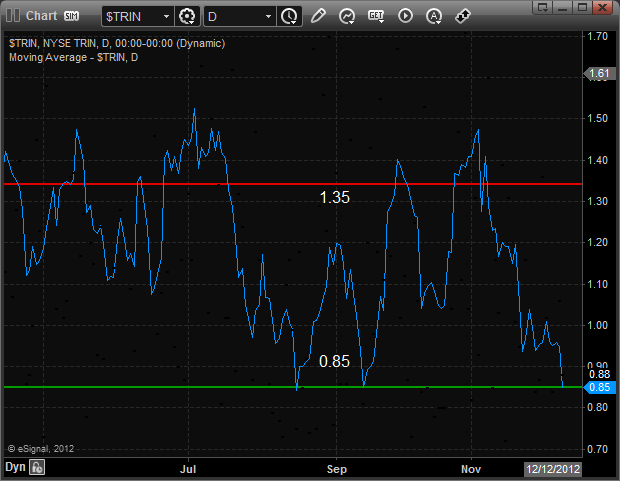
The cause for concern to the bulls is the 10-day Trin which is very close to recording the first overbought reading since mid September.
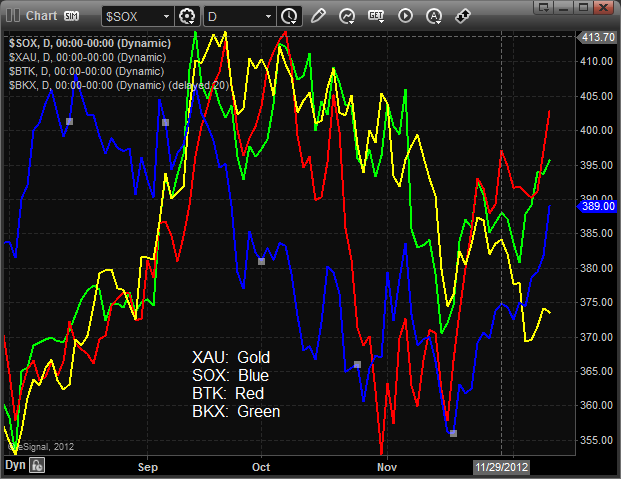
Multi sector daily chart:
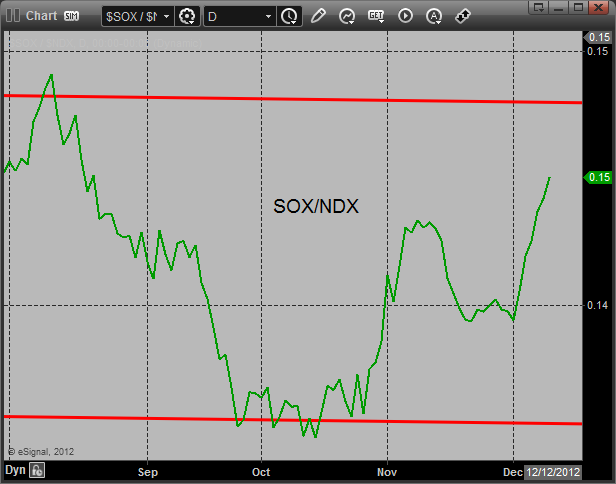
The SOX/NDX cross continues to make progress and is a very good indication that the relative weakness in the NDX may be taking a turn for the better. The NDX tends to lead the SPX and within the NDX the SOX tends to lead. So continued relative strength in the SOX is bullish for the NDX and then by extension relative strength in the NDX is bullish for the broad market.
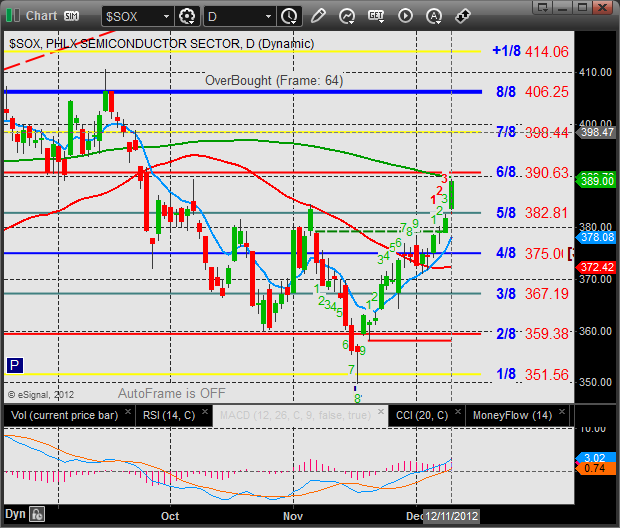
The SOX was the top gun on the day and have solidly broken out above the active static trend line. Keep in mind that as this key index has pushed higher, the 200dma will be a formidable level.
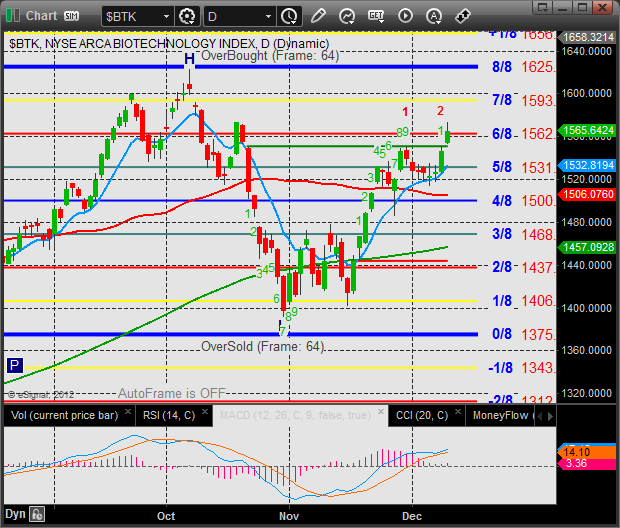
The BTK was almost as strong as the SOX and could drive up to the swing high in October.
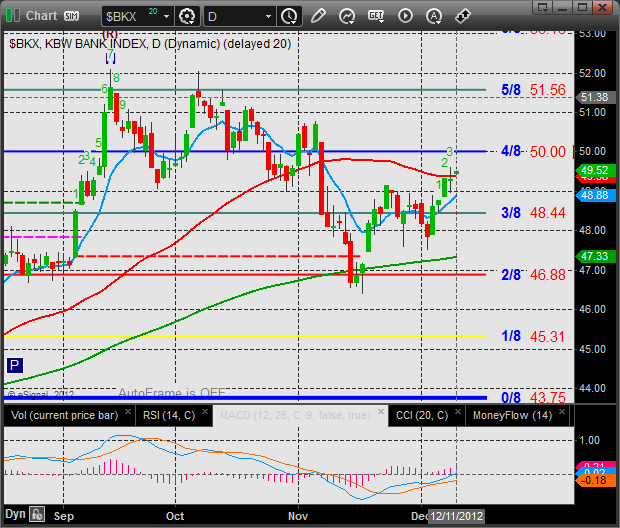
The BKX has yet to get the key boost from the MACD crossing above the zero line…stay tuned.
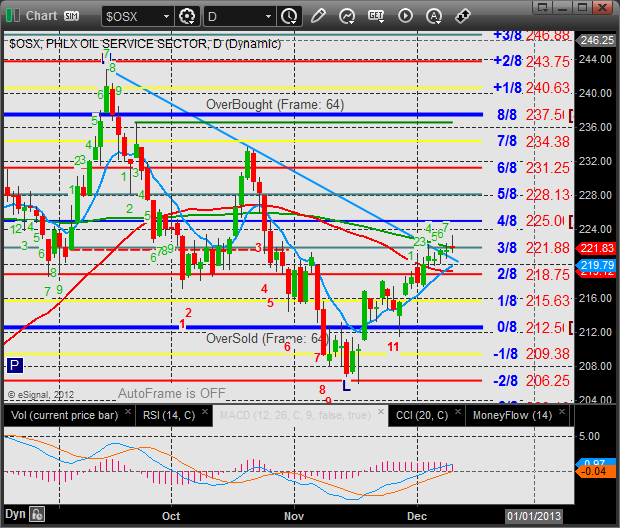
The OSX was flat on the day and is still being pulled by the DTL.
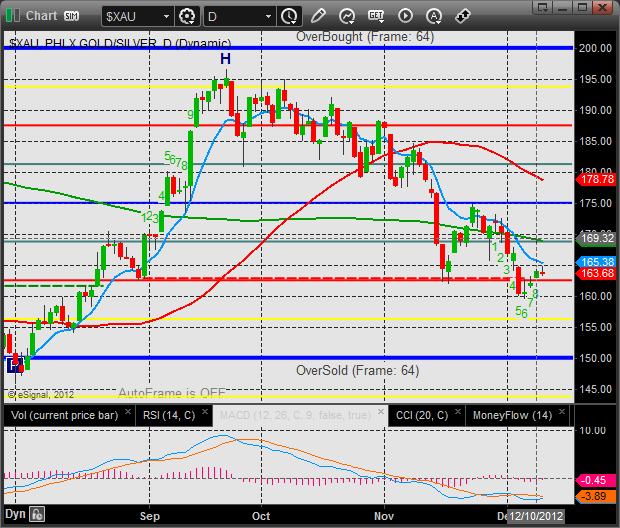
The XAU was lower on the day serving as a source of funds. Price bearishly remains below all of the important moving averages.
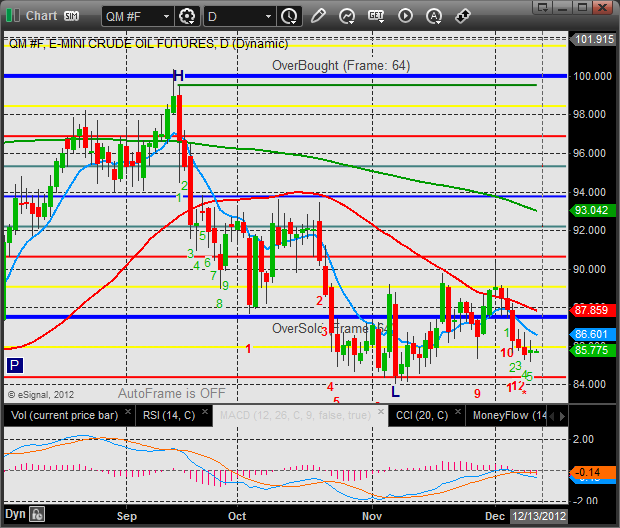
Oil:
Gold:

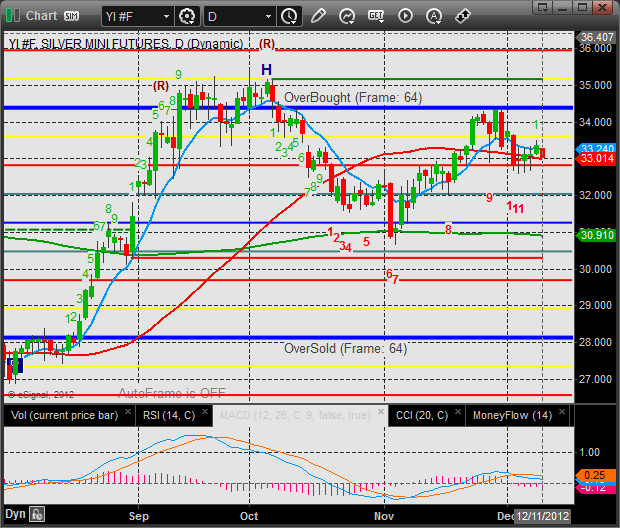
Silver:
Stock Picks Recap for 12/11/12
With each stock's recap, we will include a (with market support) or (without market support) tag, designating whether the trade triggered with or without market directional support at the time. Anything in the first five minutes will be considered WITHOUT market support because market direction cannot be determined that early. ETF calls do not require market support, and are thus either winners or losers.
From the report, CELG gapped over the trigger, no play.
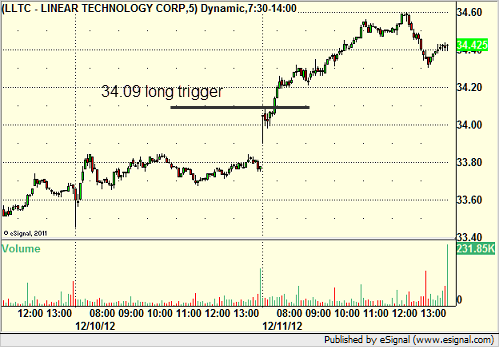
LLTC triggered long (with market support) and worked:
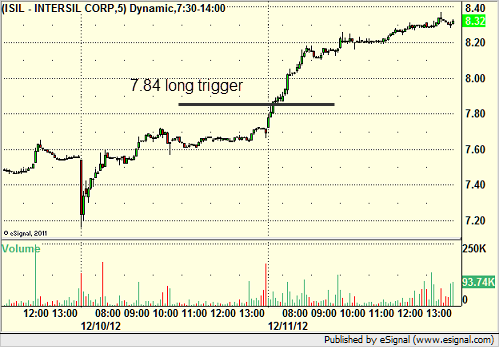
ISIL triggered long (with market support) and worked:
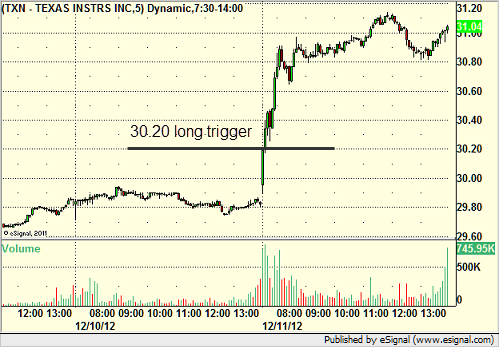
From the Messenger/Tradesight_st Twitter Feed, Rich's TXN triggered long (with market support) and worked:
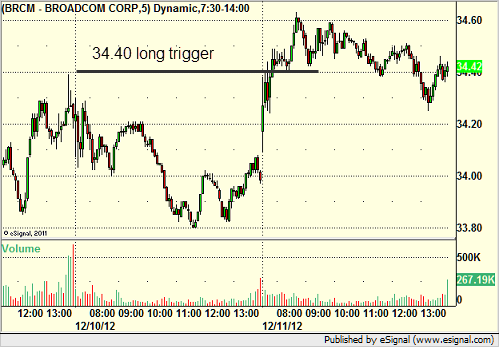
His BRCM triggered long (with market support) and worked enough for a partial:
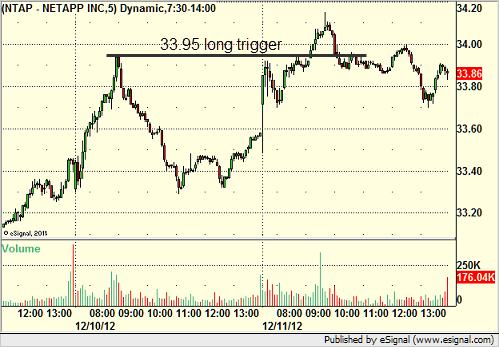
NTAP triggered long (with market support) and worked enough for a partial:
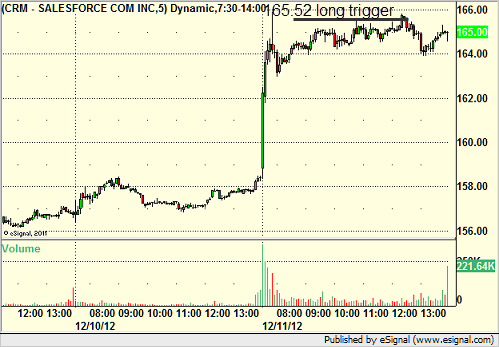
Rich's CRM triggered long (with market support) and didn't work:
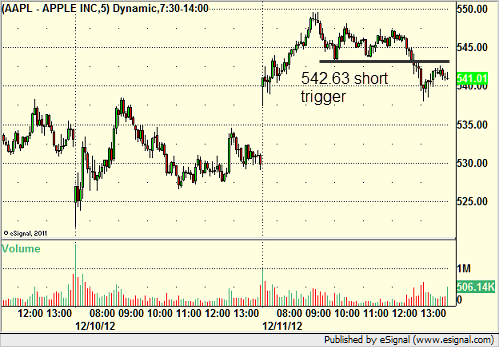
My AAPL triggered short (with market support) and worked:
In total, that's 7 trades triggering with market support, 6 of them worked, 1 did not.
Futures Calls Recap for 12/11/12
A loser and then a winner on the ES for net gains on a gap and go day that saw better volume than the prior session. We closed with 1.6 billion NASDAQ shares as we wait for tomorrow's Fed announcement.
Net ticks: +3 ticks.
As usual, let's start by taking a look at the ES and NQ with our market directional lines, VWAP, and Comber on the 5-minute chart from today's session:
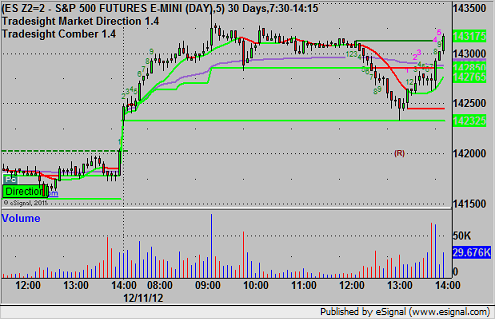
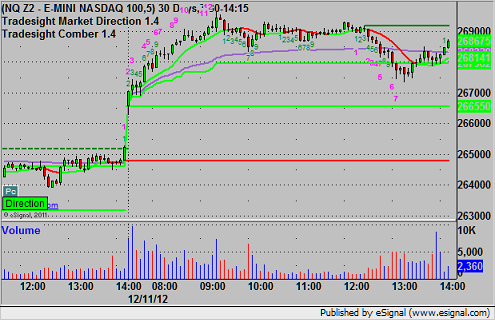
ES:
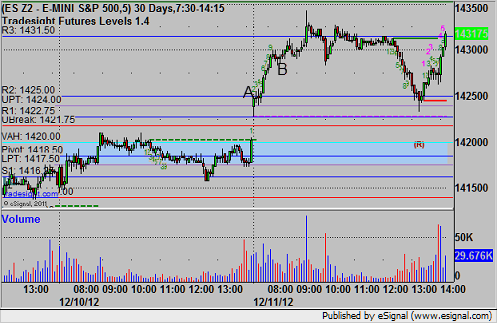
Mark's call triggered long at A at 1425.25 and stopped for 7 ticks. He put it back in again and it triggered shortly thereafter, hitting the first target for 6 ticks and, after 3 raised stops, finally stopping the final piece at 1428.50 for 13 ticks:
Forex Calls Recap for 12/11/12
Another winner in the EURUSD, this one still going. See that section below.
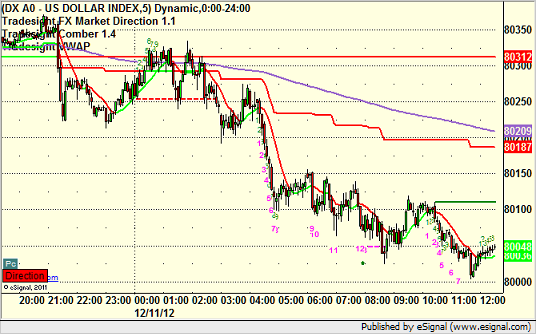
Here's a look at the US Dollar Index intraday with our market directional lines:
New calls and Chat tonight after 5 pm EST when the new levels come out after global rollover.
EURUSD:
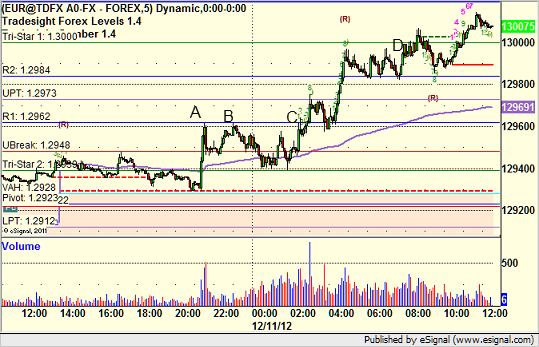
You have to love trades that exactly hit the trigger before they move through. We were looking to go long over R1, and we hit it first at A and B exactly, then triggered at C, hit first target at D, and moved the stop twice. We are currently holding with a stop under R2:
Tradesight Market Preview for 12/11/12
The ES was higher on the day by 4 handles, nominally expanding the upside of the recent range on a low volume day. While the day was unimpressive internally, this is the first session of the move that where the close settled above the open.

The NQ futures put in a similar relative performance to the SP but still have a very different technical setup as price remains below the 50 and 200dma’s. The Relative weakness in the NQ side will be discussed in more detail below. Keep a close eye on the key 4/8 Gann level just abovfe.

Multi sector daily chart:

Total put/call ratio:

The 10-day Trin remains neutral:

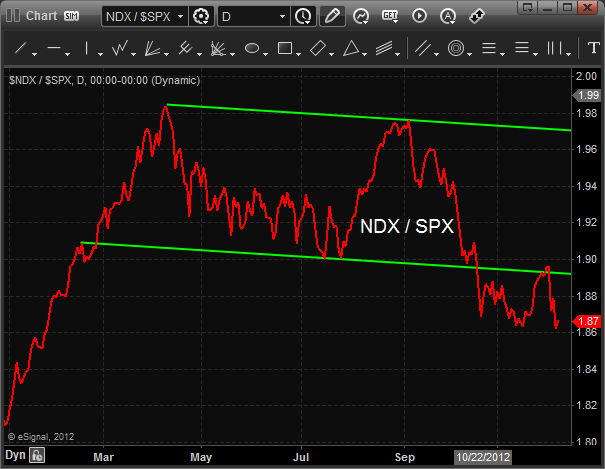
The NDX has had persistent weakness vs. the SPX side since mid-September. This is a clear warning sign and a classic intermarket divergence. This condition needs to be rectified or it will surely hold back the overall broad market. Note the attempt to break back into the trend channel and rejection.
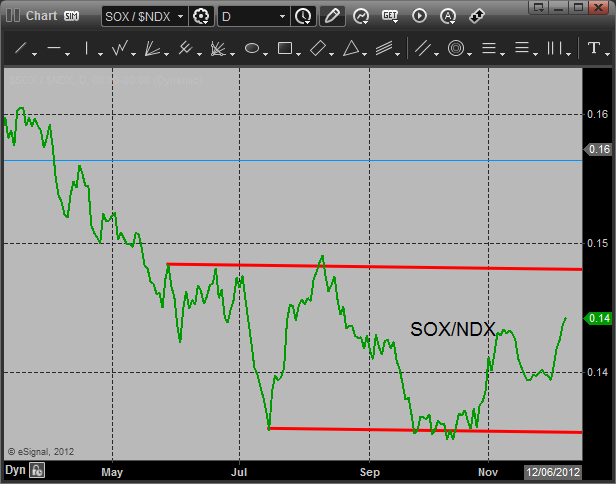
While the NDX tends to lead the SPX within the NDX there is a key leading component the SOX. As described above the NDX has relative weakness but the SOX has been improving after not making a new relative low. If the SOX can get back above the trend channel, then the NDX will have its trend leading component in a bullish position of relative strength.
The BTK was the top Naz sector, once again challenging the active static trend line.

The XAU is bouncing off a short-term oversold condition.

The SOX has settled above the static trend line and is now on the north side of the 10ema and 50dma. The next challenge will be the 200dma if it can clear relatively minor 5/8 Murrey math level.

The OSX is still grinding in the area of the active DTL:

The BKX was a laggard and is still contained by the 50dma:

If oil moves just a bit lower it will record a Seeker exhaustion buy:

Gold:

Silver:

Stock Picks Recap for 12/10/12
With each stock's recap, we will include a (with market support) or (without market support) tag, designating whether the trade triggered with or without market directional support at the time. Anything in the first five minutes will be considered WITHOUT market support because market direction cannot be determined that early. ETF calls do not require market support, and are thus either winners or losers.
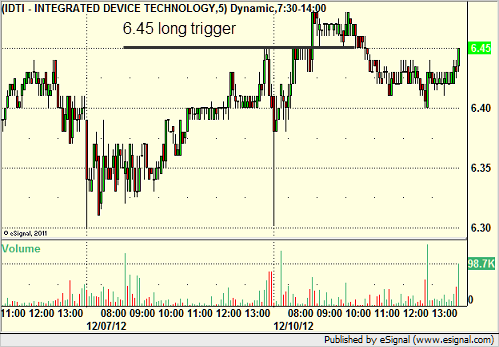
From the report, IDTI triggered long (with market support) and didn't go enough in either direction to count:
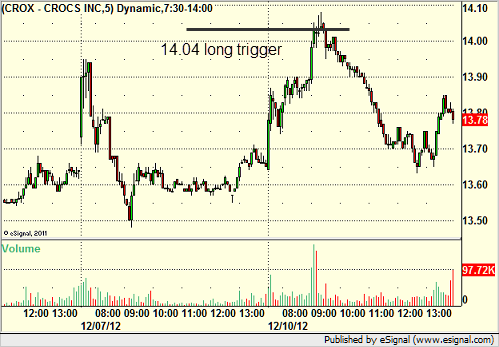
CROX triggered long (with market support) and didn't work:
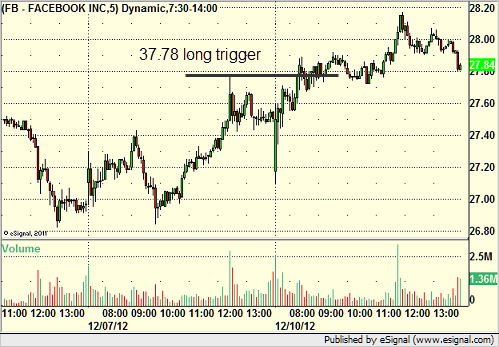
From the Messenger/Tradesight_st Twitter Feed, Rich's FB triggered long (with market support) and worked:
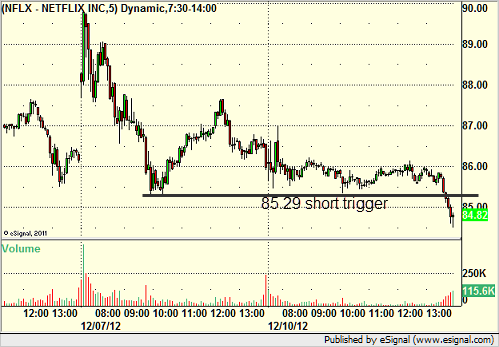
NFLX triggered short (without market support) and worked:
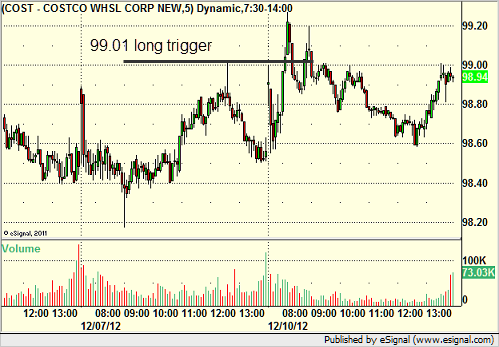
COST triggered long (with market support) and worked enough for a partial:
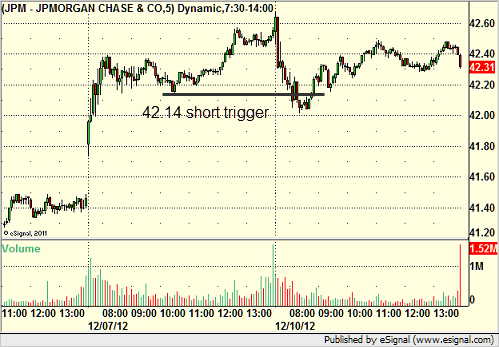
Rich's JPM triggered short (without market support) and didn't work:
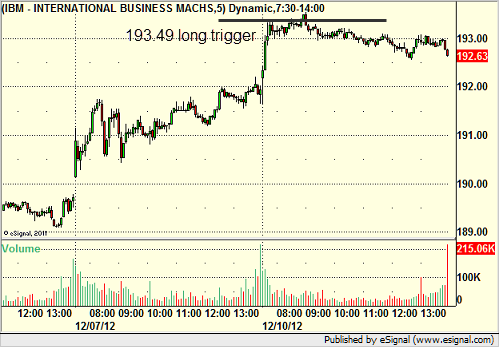
His IBM triggered long (with market support) and didn't work:
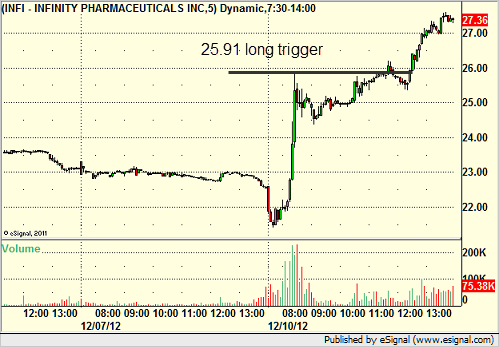
His INFI triggered long (with market support) and worked enough for a partial, and worked again later too:
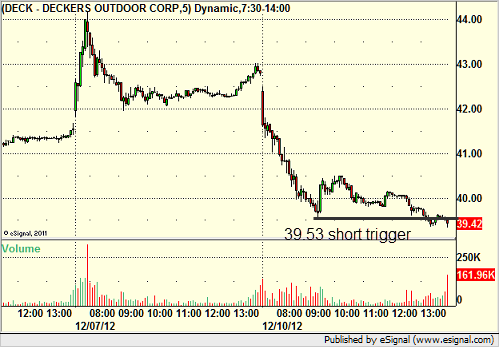
His DECK triggered short (without market support) and didn't go enough in either direction to count:
In total, that's 6 trades triggering with market support, 3 of them worked, 3 did not.
Futures Calls Recap for 12/10/12
A very limited day in the market on light volume. Mark's ES trade triggered twice, worked once. See that section below. NASDAQ volume was only 1.4 billion shares.
Net ticks: -4.5 ticks.
As usual, let's start by taking a look at the ES and NQ with our market directional lines, VWAP, and Comber on the 5-minute chart from today's session:


ES:
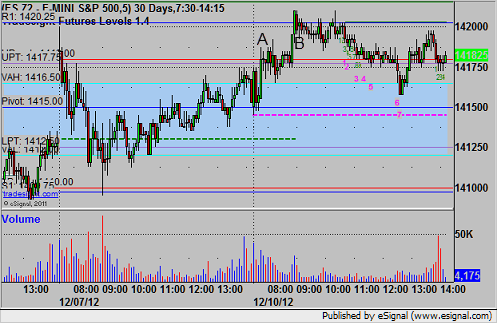
Triggered long at A at 1419.00 and stopped for 7 ticks. Triggered again at B, hit first target for 6 ticks, and stopped the second half under the entry:
Forex Calls Recap for 12/10/12
And back to limited ranges. The EURUSD triggered long but never hit the stop or first target. I finally closed it just a little in the money for the end of the session. See that section below.
Here's a look at the US Dollar Index intraday with our market directional lines:

New calls and Chat tonight after 5 pm EST when the new levels come out after global rollover.
EURUSD:
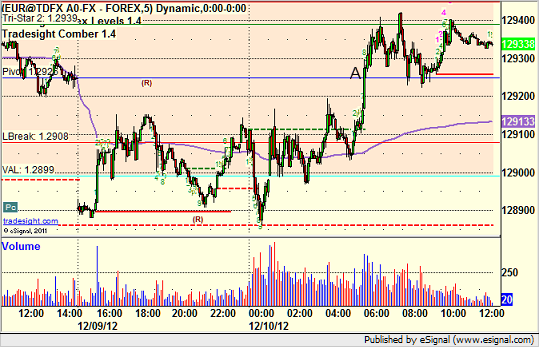
Triggered long at A, closed at end of chart for end of session just barely in the money:
Tradesight November 2012 Futures Results
Before we get to November’s numbers, here is a short reminder of the results from October. The full report from October can be found here.
Tradesight Tick Results for October 2012
Number of trades: 39
Number of losers: 18
Winning percentage: 53.8%
Net ticks: -27 ticks
Reminder: Here are the rules.
1) Totals for the month are based on trades that occurred on trading days in the calendar month.
2) Trades are based on the calls in the Messenger exactly as we call them and manage them and do not count everything you could have done from taking our courses and using our tools.
3) All trades are broken into two pieces, with the assumption that one half is sold at the first target and one half is sold at the final exit. These are then averaged. So if we made 6 ticks on one half and 12 on the second, that’s a 9-tick winner.
4) Pure losers (trades that just stop out) are considered 7 tick losers. We don’t risk more than that in the Messenger calls.
You can go through the reports and compare the breakdown that I give as each trade is reviewed.
Tradesight Tick Results for November 2012
Number of trades: 26
Number of losers: 16
Winning percentage: 38.4%
Net ticks: -27 ticks
A very strange month. Volume was light. We had the Hurricane that killed off action early. The election played a role. We had another bank Holiday in Veteran's Day. We had Thanksgiving. In the end, we only had 26 trades trigger, compared to 36 the prior month and more typically. It's just a weird month. Market volume was light the whole month, so size should have been limited. We started out strong and were profitable until the last two days of the month and then got stopped out of several trades in a row that killed us. Hopefully, December is better.
Tradesight November 2012 Forex Results
Before we get to November’s numbers, here is a short reminder of the results from October. The full report from October can be found here and you can get the last several months in a row vertically by clicking here and scrolling down.
Tradesight Pip Results for October 2012
Number of trades: 24
Number of losers: 16
Winning percentage: 33.3%
Worst losing streak: 5 in a row (middle of the month)
Net pips: -100
Reminder: Here are the rules.
1) Calls made in the calendar month count. In other words, a call made on August 31 that triggered the morning of September 1 is not part of September. Calls made on Thursday, September 30 that triggered between then and the morning of October 1 ARE part of September.
2) Trades that triggered before 8 pm EST / 5 pm PST (i.e. pre Asia) and NEVER gave you a chance to re-enter are NOT counted. Everything else is counted equally.
3) All trades are broken into two pieces, with the assumption that one half is sold at the first target and one half is sold at the final exit. These are then averaged. So if we made 40 pips on one half and 60 on the second, that’s a 50-pip winner. If we made 40 pips on one half, never adjusted our stop, and the second half stopped for the 25 pip loser, then that’s a 7 pip winner (15 divided by 2 is 7.5, and I rounded down).
4) Pure losers (trades that just stop out) are considered 25 pip losers. In some cases, this can be a few more or a few less, but it should average right in there, so instead of making it complicated, I count them as 25 pips.
5) Trade re-entries are valid if a trade stops except between 3 am EST and 9 am EST (when I’m sleeping). So in other words, even if you are awake in those hours and you could have re-entered, I’m only counting things that I would have done. This is important because otherwise the implication is that you need to be awake 24/6. Triggers that occur right on the Big Three news announcements each month don’t count as you shouldn’t have orders in that close at that time.
You can go through the reports and compare the breakdown that I give as each trade is reviewed.
Tradesight Pip Results for November 2012
Number of trades: 21
Number of losers: 13
Winning percentage: 38%
Worst losing streak: 4 in a row (end of the month)
Net pips: -45
Last month we set a record by having two months in a row of negative returns from our Forex calls, although we lowered our size to half in late August and have maintained that size. November didn't improve the situation as we net lost 45 pips in November, the third month in a row (and the first time in 7 years of 3 months of negative returns), but we continue to be half size (and the only time since 2007 that we have been half size this far into the post-summer months). Frankly, it's just a mess, but it won't stand forever, and the fact that we have been half size in the first 3-month period of net losses shows that the system works. Also, having said that, we think things will pick up soon as the ranges have dropped to intolerable levels unseen in a decade.
It should also be noted that losing only 45 pips at half size is minor, and we only had 21 trades trigger (a record low) due to Hurricane Sandy and other factors (Thanksgiving and more). In other words, our system continues to protect our subscribers from bad environments.
