Forex Calls Recap for 9/5/12
Another half-sized night without anything special. See EURUSD below.
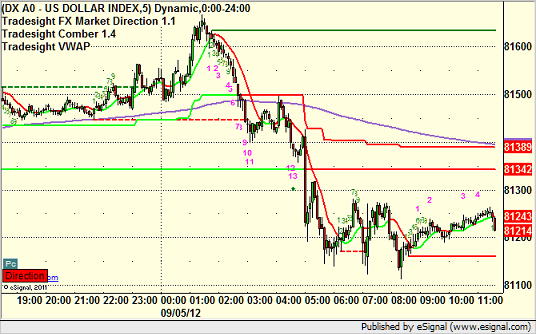
Here's a look at the US Dollar Index intraday with our market directional lines:
New calls and Chat tonight after 5 pm EST when the new levels come out after global rollover.
EURUSD:
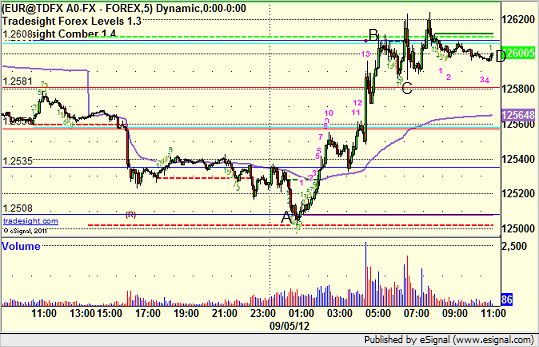
Triggered short at A and stopped for 25 pips. Triggered long at B, stopped a piece of the trade at C, retriggered the rest and eventually closed at D for 12 pips:
Tradesight Market Preview for 9/5/12
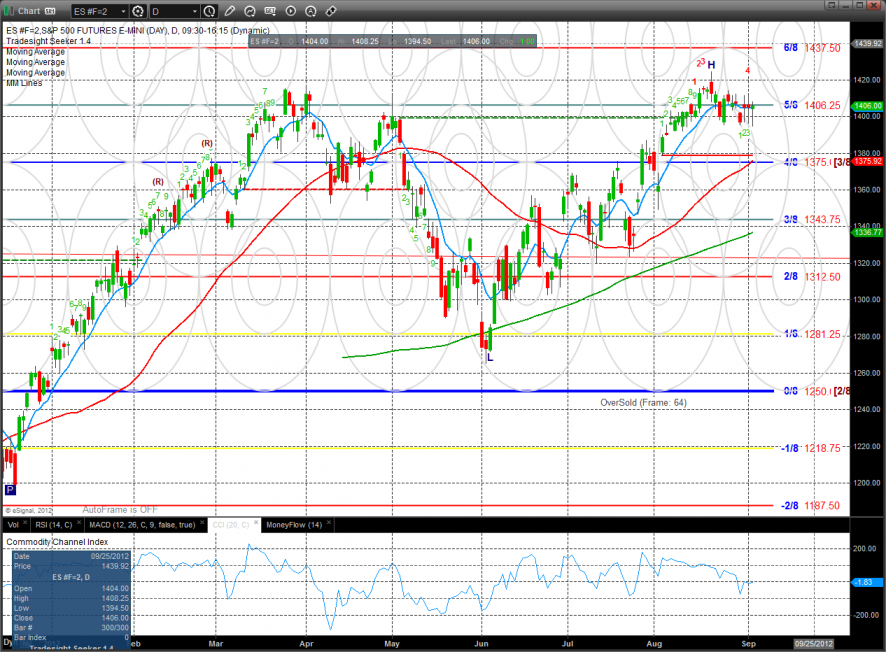
The ES had a wild ride recouping some steep program driven losses mid-day to settle flat on the day. Price has settled 3 times now in the same area so when this range is resolved it should be powerful.
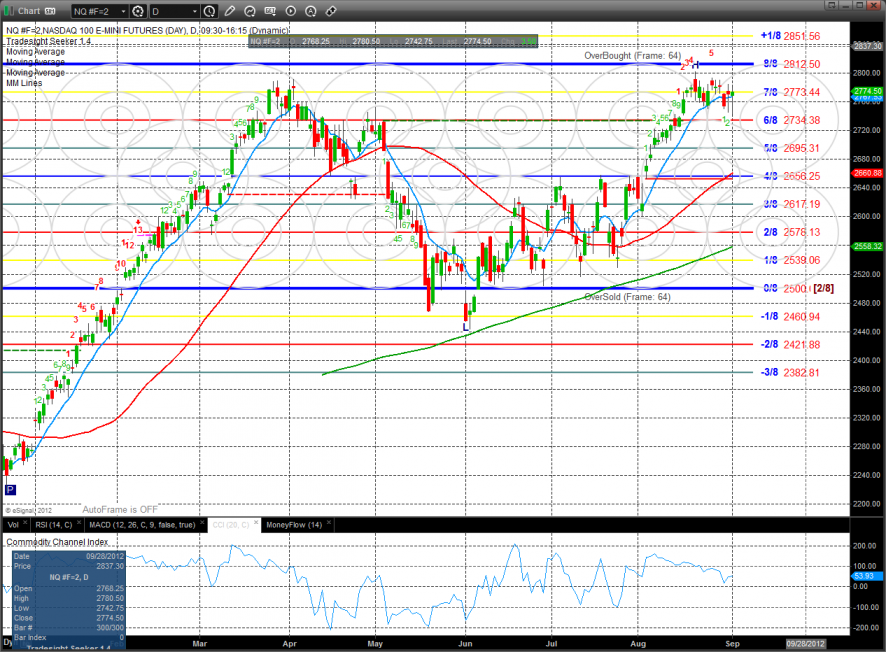
The NQ futures were slightly higher on the day with the same overall pattern as the ES. Price is still consolidating the area of the prior high. Note the key 8/8 level just above those levels.
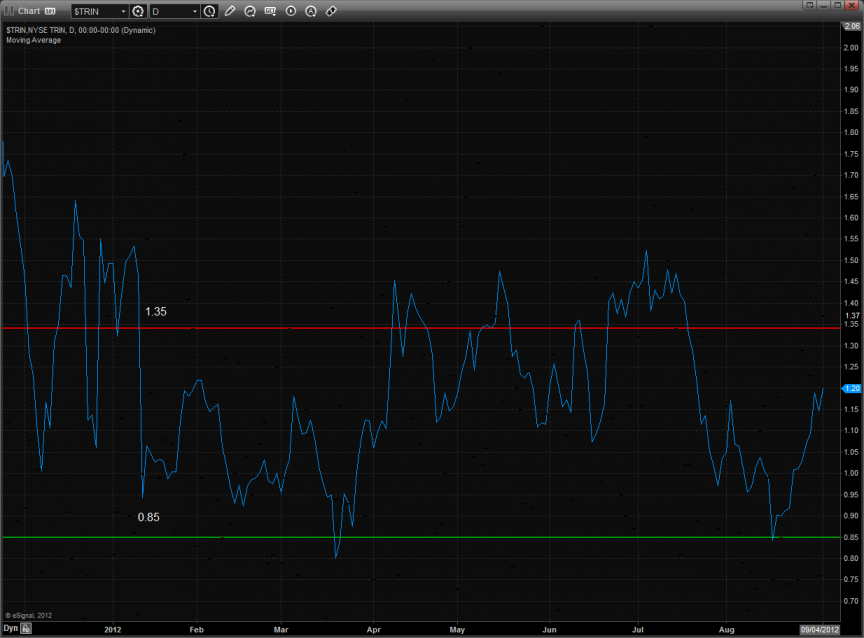
The 10-day Trin is moving towards the oversold threshold of 1.35+
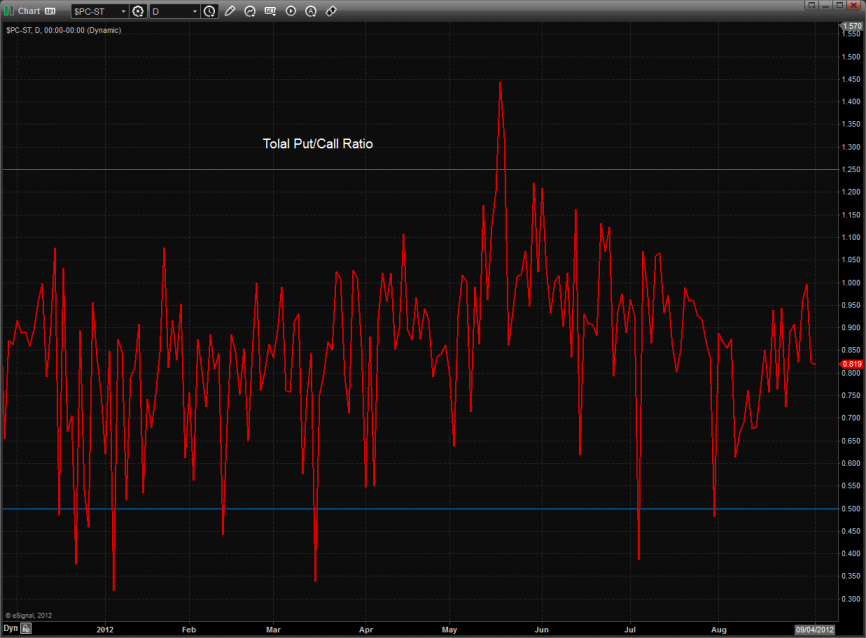
The total put/call ratio is neutral:
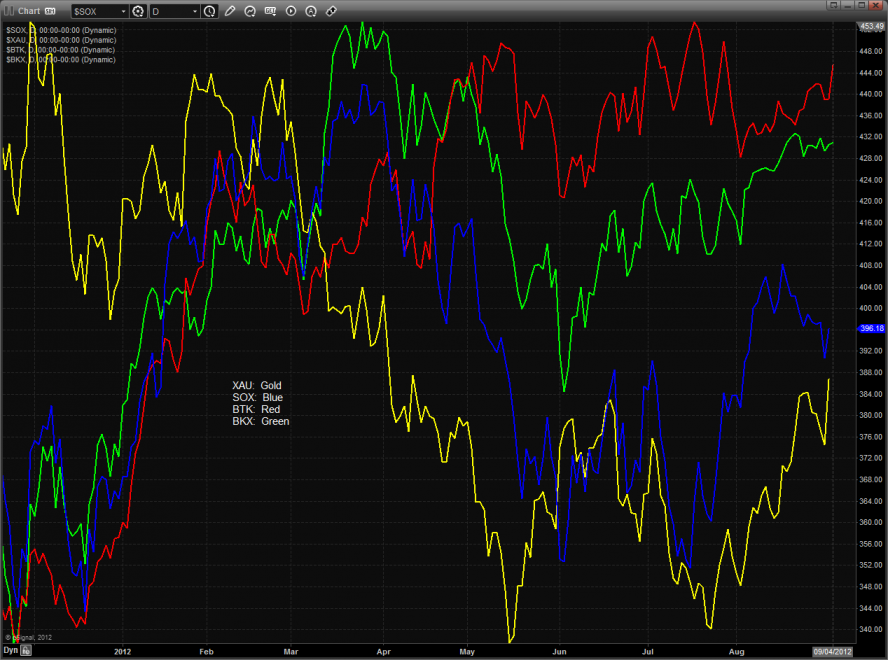
Multi sector daily chart;
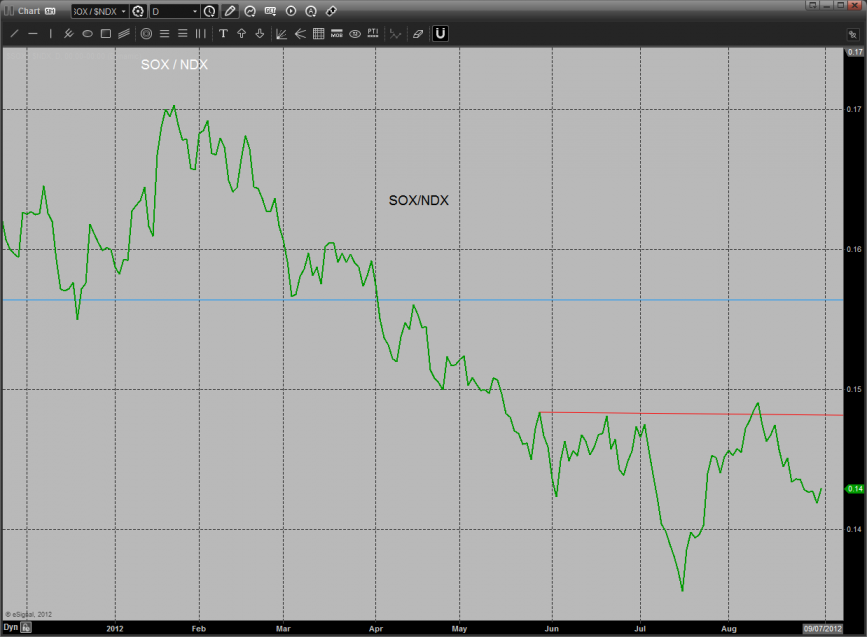
The SOX/NDX cross continues to spin its wheels and not gain any traction. Note that the pattern is setting up a reverse H & S.
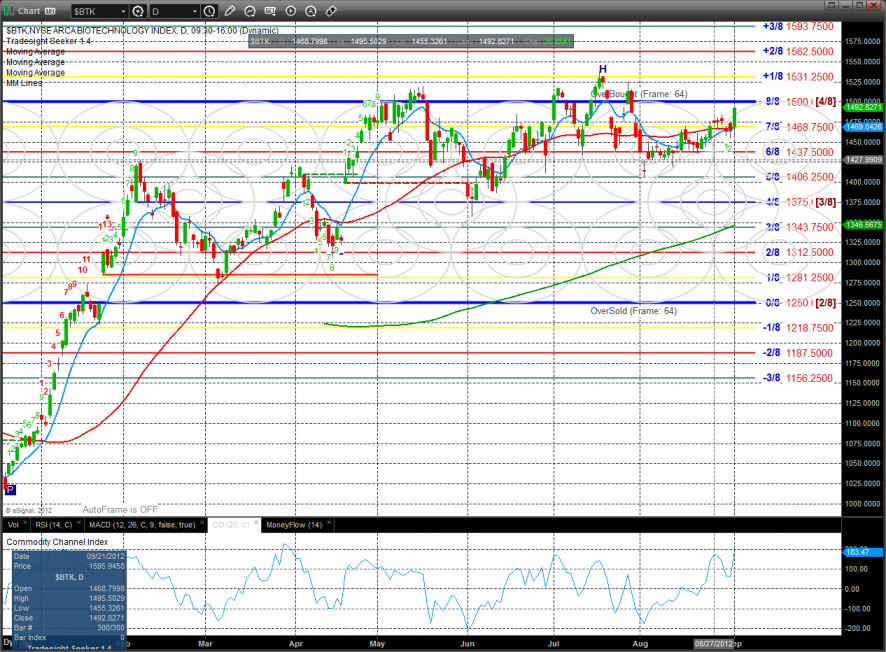
The BTK was the top gun on the day and cleared the recent trading range. The 8/8 level could be stiff overhead on the first try and may be a point of necessary consolidation.
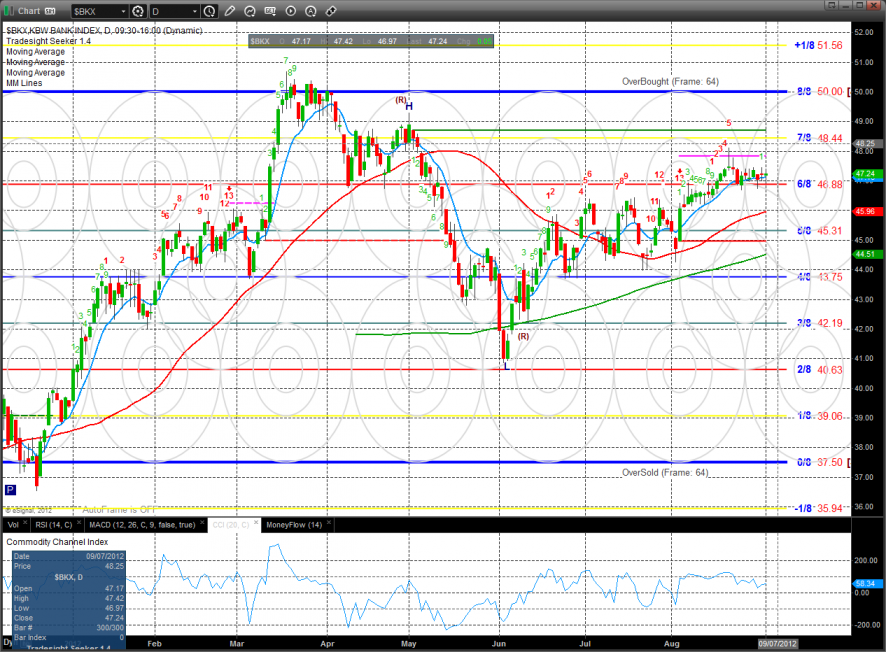
The BKX remains trapped and is likely the key to getting a resolution to the ES range.
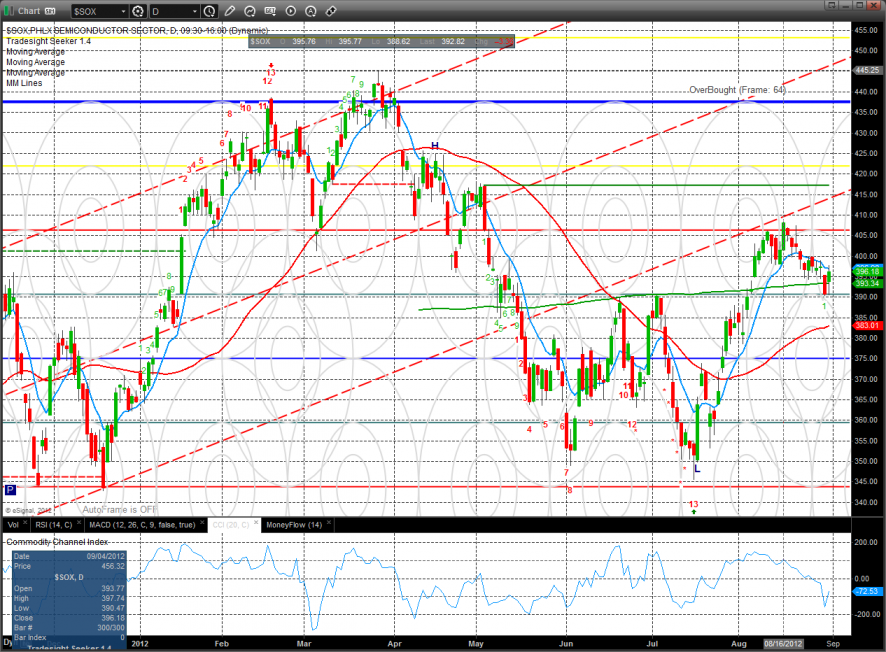
The SOX was weaker than the NDX and broad market today. This is a negative divergence and will hold back the overall NDX until the relative weakness is shaken off.
The OSX was the weakest major index and remains below the 200dma.
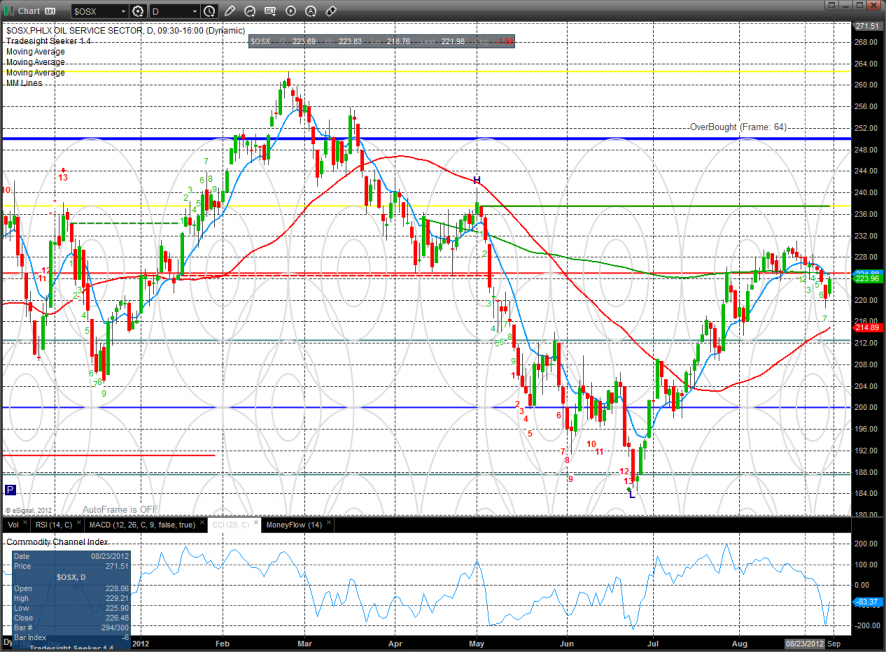
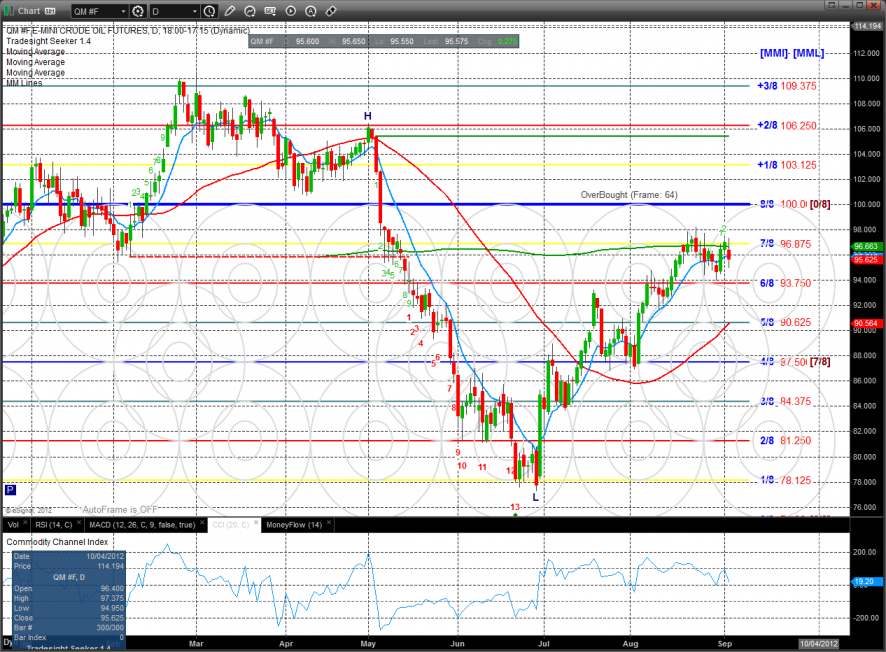
Oil:
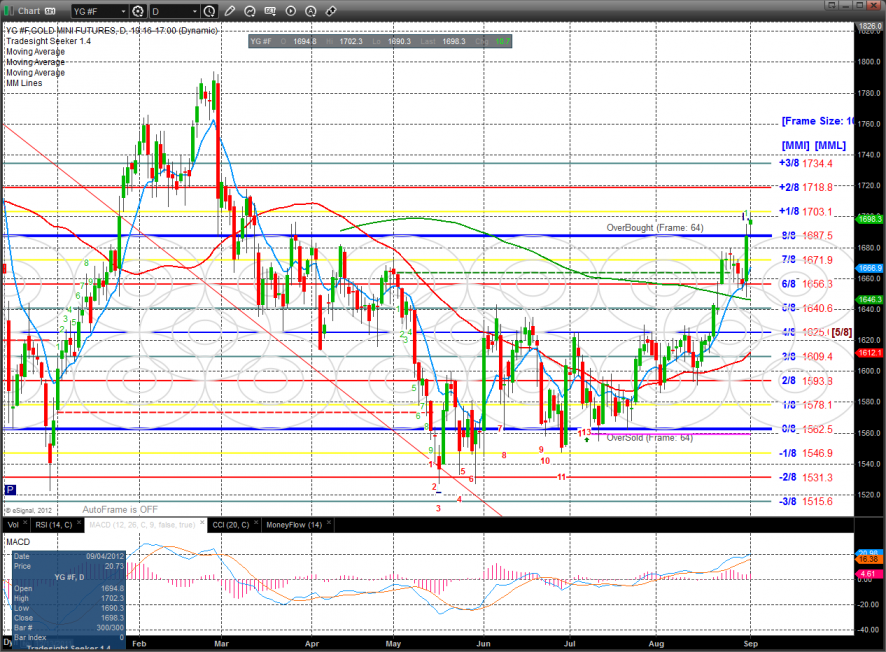
Gold has broken out and settled above the key 8/8 level. The next overhead will be the +2/8 Murrey math level. Note that the MACD is not yet overbought.
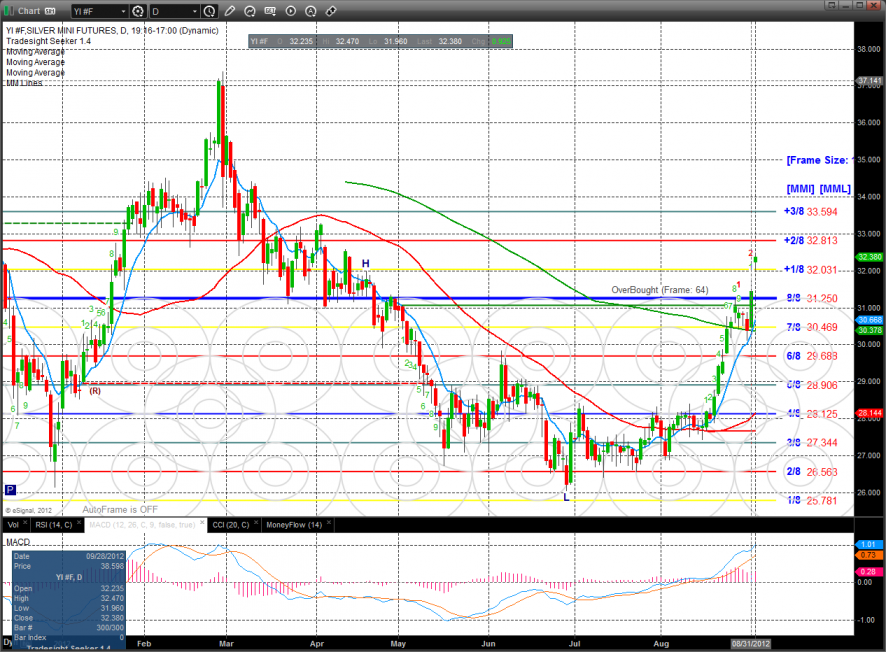
Silver has the same pattern as gold with a little more relative strength due to its higher volatility.
Stock Picks Recap for 9/4/12
With each stock's recap, we will include a (with market support) or (without market support) tag, designating whether the trade triggered with or without market directional support at the time. Anything in the first five minutes will be considered WITHOUT market support because market direction cannot be determined that early. ETF calls do not require market support, and are thus either winners or losers.
Some big winners early in the session when the volume was there.
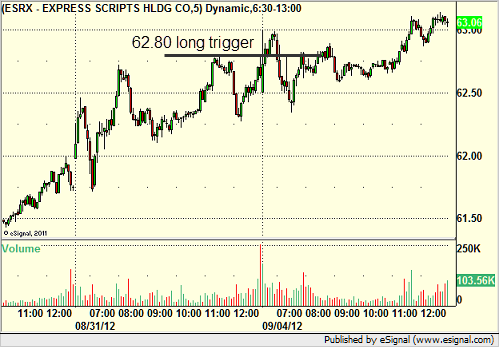
From the report, ESRX triggered long (without market support due to opening five minutes) and didn't work:
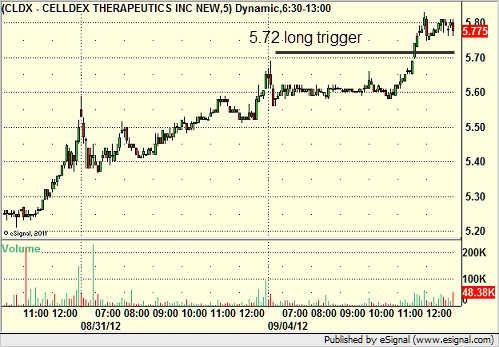
CLDX triggered long (with market support) and was starting to work:
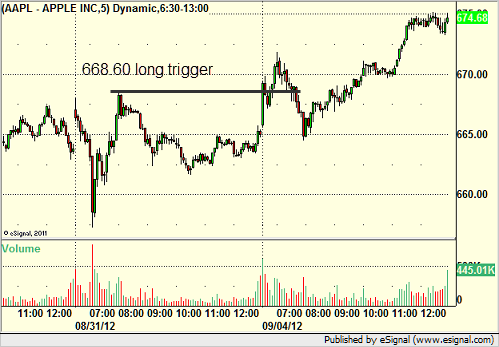
From the Messenger/Tradesight_st Twitter Feed, Rich's AAPL triggered long (without market support due to opening 5 minutes) and worked:
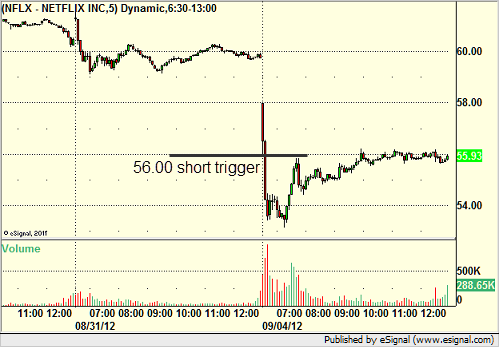
His NFLX triggered short (with market support) and worked:
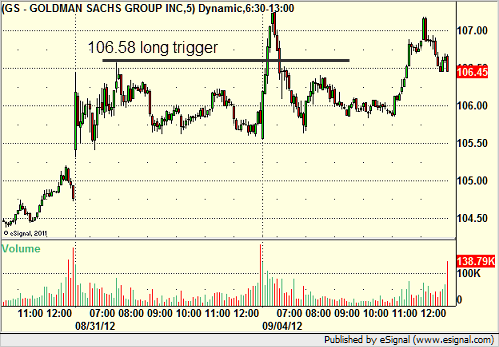
His GS triggered long (without market support) and worked:
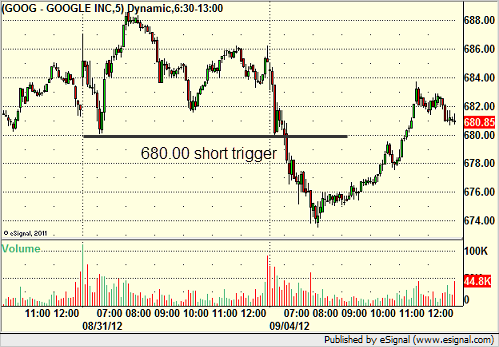
His GOOG triggered short (with market support) and worked:
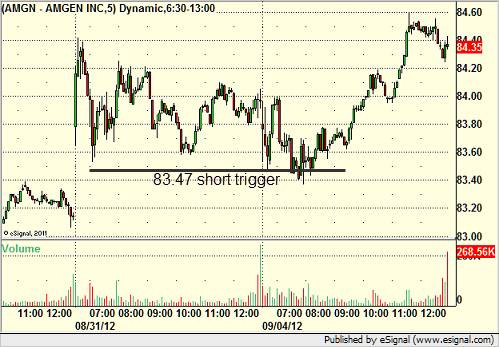
AMGN triggered short (with market support) and didn't work:
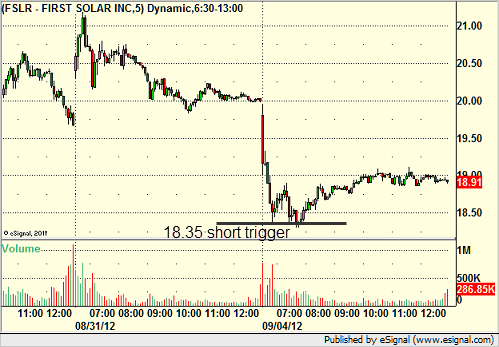
Rich's FSLR triggered short (with market support) and didn't work:
BIIB triggered long (with market support) and worked enough for a partial:
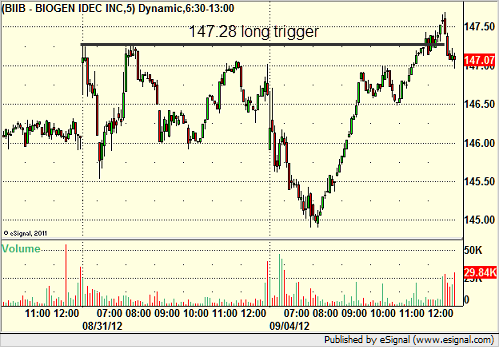
Rich's AAPL triggered long (with market support) and didn't work:
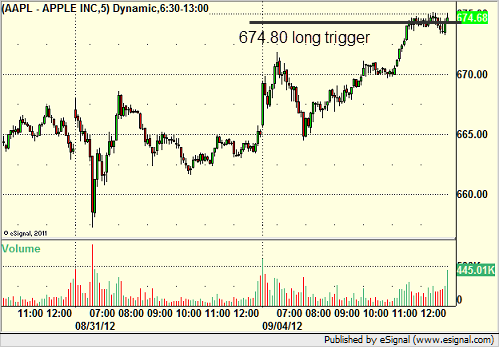
In total, that's 7 trades triggering with market support, 4 of them worked, 3 did not.
Futures Calls Recap for 9/4/12
A nice setup in the morning on the ES didn't end up triggering until the afternoon. Market volume was still weak coming back from the Holiday, closing out at 1.4 billion NASDAQ shares, but hopefully that will rise as the week moves along.
Net ticks: +5 ticks.
As usual, let's start by taking a look at the ES and NQ with our market directional lines, VWAP, and Comber on the 5-minute chart from today's session:
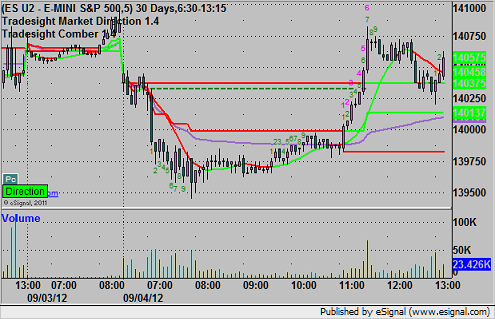
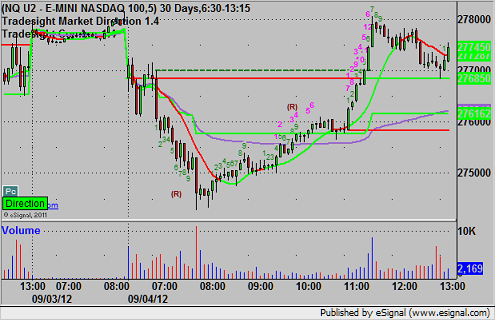
ES:
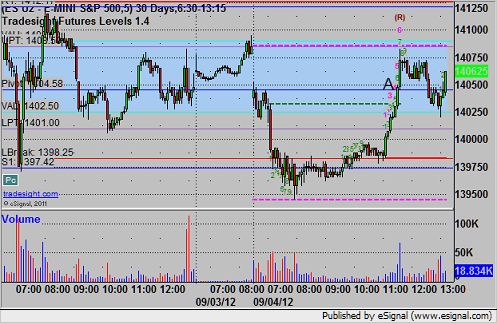
Triggered long at 1405.00 at A, hit first target for 6 ticks and moved stop up and stopped in the money:
Forex Calls Recap for 9/4/12
A non-event to start the month. See EURUSD below. We remain half size until we start to see ranges expand, and even with that, only part of the trade triggered.
Here's a look at the US Dollar Index intraday with our market directional lines:

New calls and Chat tonight after 5 pm EST when the new levels come out after global rollover.
EURUSD:
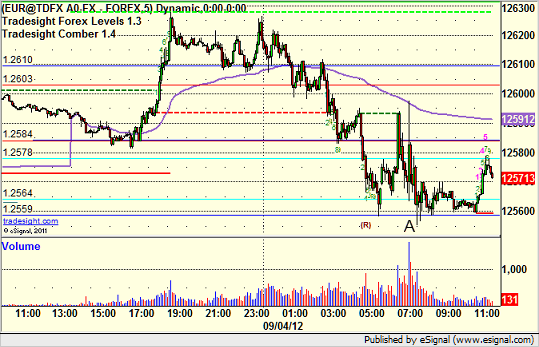
After a night spent mostly between our two triggers, the EURUSD swept the S2 level at 1.2559. Our staggered entries would be 1.2557, 1.2556, and 1.2555, the last of which never hit on the charts, so only 2/3rds of the trade (which was only half size anyway) triggered. It never stopped either, and I eventually closed at the end of the chart:
Tradesight Special Market Commentary for September 2012
Summer is ending. This is Labor Day weekend, 2012, and it is the traditional end of summer. This has a lot of implications historically for the stock market.
1) August is typically an up month for the markets, albeit on lighter volume, and we got both. It was a positive month for the indices, but it was particularly weak on volume, and got exceptionally worse in the last week of the month, with NASDAQ volume closing Friday at 1.1 billion shares, down from the much higher numbers around 1.6 billion earlier in the month.
2) September is, historically, the most negative month of the year. In fact, if you take the last 100 years of the stock market and average the returns for each month for 100 years, September is the ONLY month that gives you a negative average return.
3) There is a lot of correlation between that and the Federal fiscal year, which ends at the end of September.
This year, we have a lot of extraordinary events occurring that play a role in the current state of the market. These include, but most likely a not limited to:
1) The situation in Europe and the lack of clarity about one of our biggest trading partners.
2) Signs of a slowdown in China.
3) The Presidential election cycle here in the US.
4) The potential "fiscal cliff" here in the US in 2013 (the point at which, if something isn't done (see below), the country could be in grave financial difficulty).
5) The "Facebook" situation, since the end of May, see below.
These are all factors that play into the markets at this point. To be clear, the economy is not slowing down. If it were, the stock market, would roll to the downside 6-9 months ahead of any correction, as it always has. That isn't the problem. The problem is that NOTHING is occurring. Things aren't getting worse or better. We aren't seeing signs of strength or weakness globally. We don't know if some of the key players are going to fix or make worse their problems. It's a mess, but it is a mess that adds up to sideways action without volume instead of a decline on volume (such as 2008, where we could easily make money on the short side).
So let's tick off these individual points and prepare ourselves for the last third of 2012, and I'll do it without assuming that the end of the world is actually going to happen, as the Mayans predicted.
Let's start with the near-term stuff.
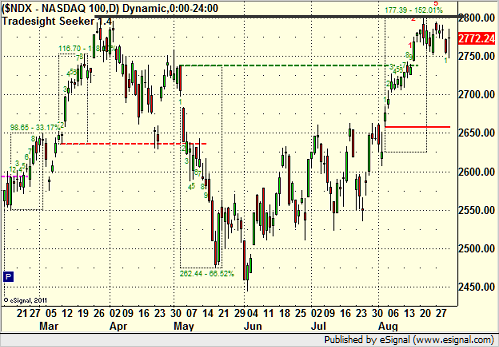
The NDX has set up a brilliant cup and handle breakout this year for the 1400 level, and even if we do get a pullback in September, a turn up at some point in October should lead us to this breakout in the last three months of the year, and the construction is solid enough that it should be meaningful:
With that, the broader market, as measured by the S&P 500, is doing the same:

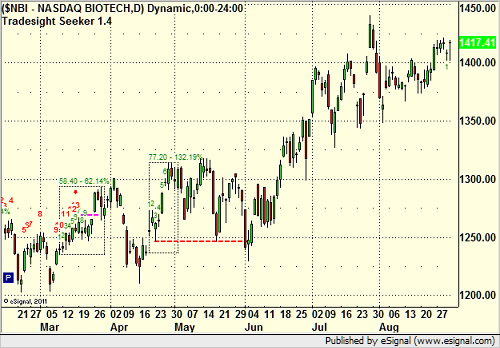
The old saying is that Banks and Biotechs lead a rally. Banks are doing good, and Biotechs are also strong:
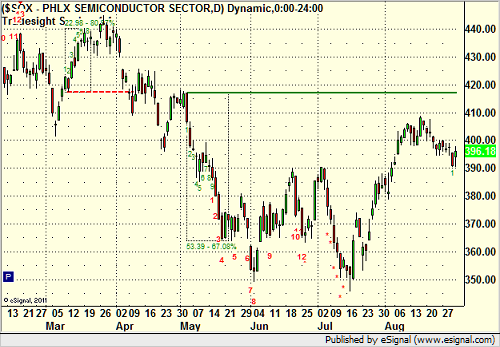
The disappointment is maybe Semiconductors, which aren't at an especially strong point on the charts:
Volume plays a key role in the markets, and it isn't very difficult to analyze what we are seeing. Here is this year to date with a 10-day blue moving average line for volume on the NASDAQ:
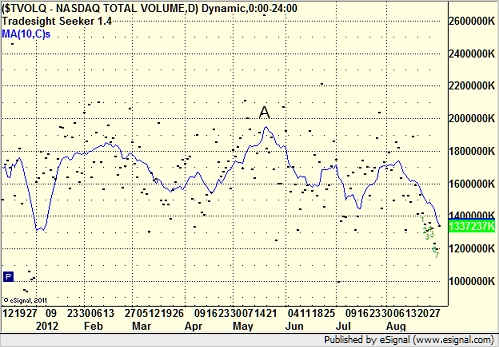
What you see is not only that volume dropped off sharply in August, but also that it topped around May 20 (point A), which is TO THE DAY the date that Facebook came public, taking half a trillion dollars of hot trading money and locking it up in a stock.
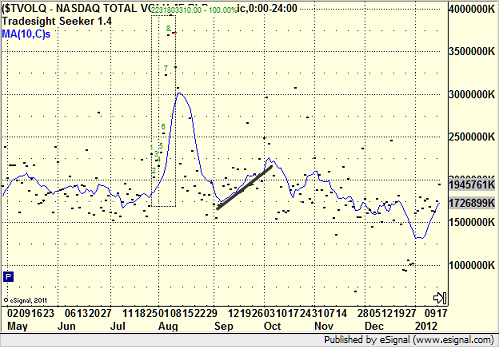
But the other factor is that August usually sees lighter volume, and then things pick up in September. For example, 2011 (I've drawn a black line along the average volume line for September for each year):
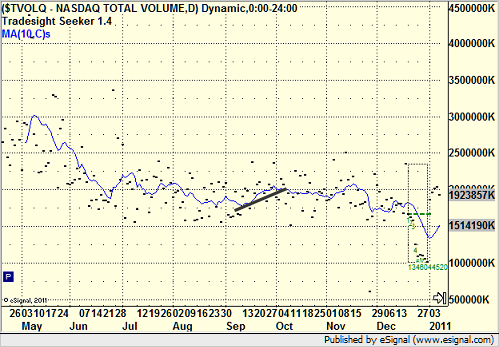
Or 2010:
Or 2009:
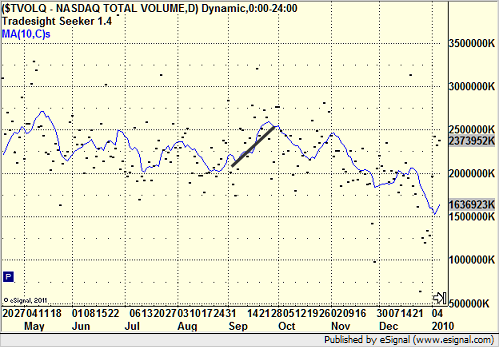
2008 isn't as fair because the last plunge from the bank collapse occurred there and so of course volume picked up:
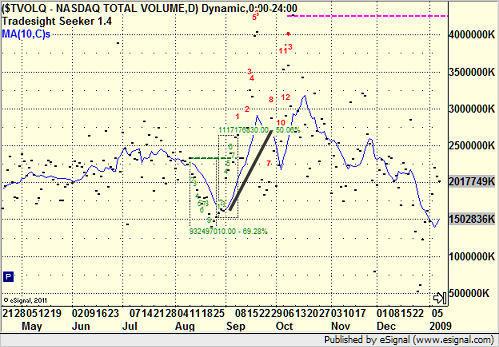
But even if you go back to 2006, you see the same pattern:
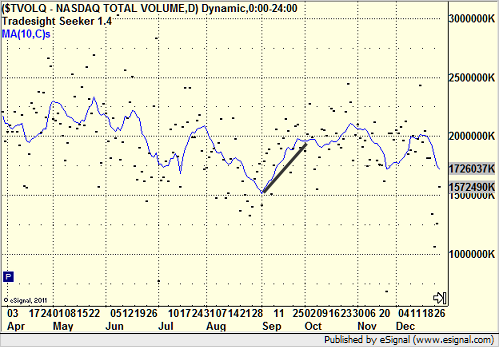
It has always been the case that volume dips in August, which is usually a positive month for stocks because the professional short-players are away on vacation, and then volume comes back in September, usually taking the market lower.
The NDX in 2011, the market headed down in September:
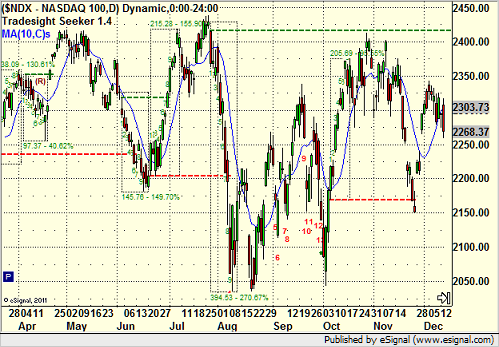
The NDX in 2010, the market was UP HUGE in September, so you can't just assume:
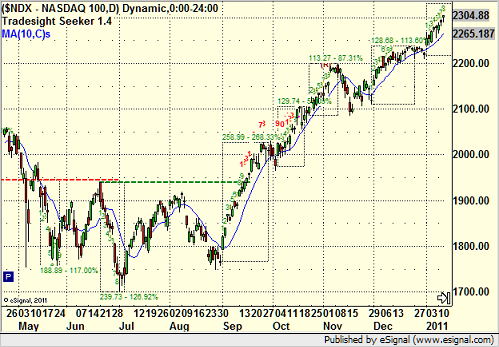
In 2008 we were down with the bank collapse:
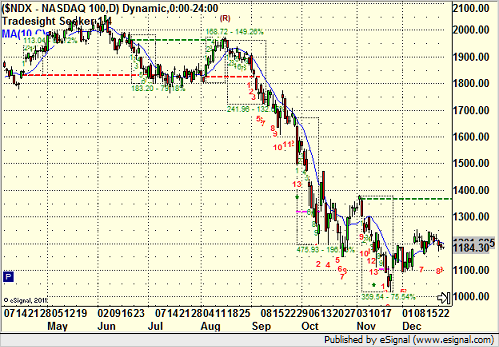
So it all starts to fit together.
Let's put some of the broader moves in perspective. Here's the NDX going back 10 years with the 2008 banking collapse in the box:
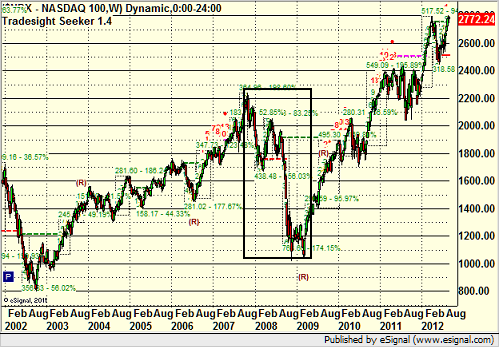
What you can see is that the tech sector has already erased the plunge and gone higher.
Meanwhile, the broader market, which includes the banks, in the same period, has erased the loss but nothing more:
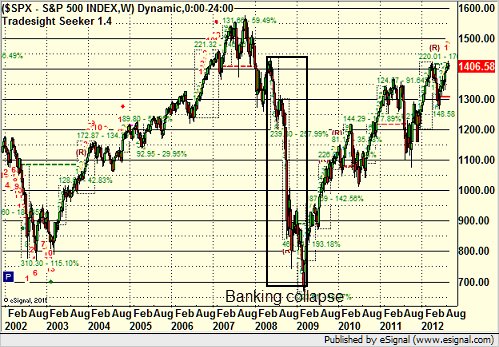
But since we are looking at potential breakouts in both, things seem positive, and another round of Fed easing would help.
What about if we look back further?
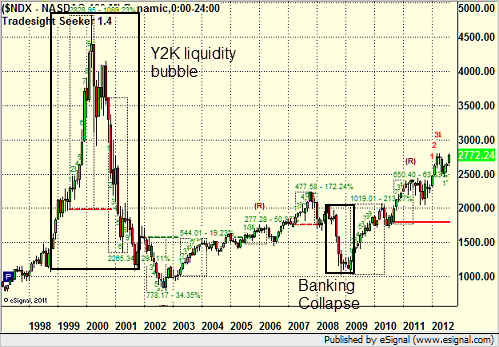
Here's the NDX going back to the mid 1990s, and you can see the Y2K liquidity Internet bubble:
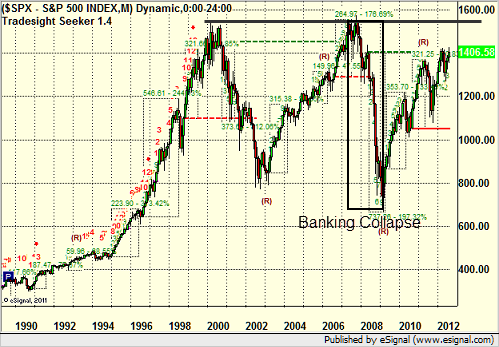
The S&P doesn't look as dramatic, and in fact, the Y2K rise and decline matches off with the banking collapse in 2008 and gives us a breakout point to watch for the broad market:
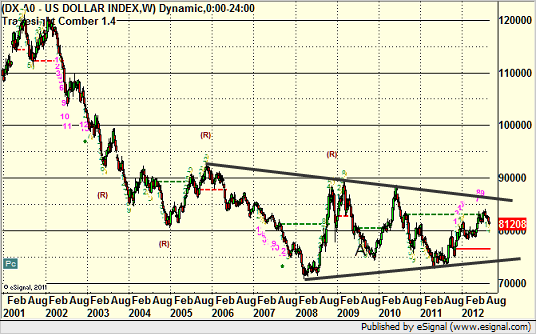
Meanwhile, let's flip the conversation for a minute to the US Dollar Index, which is also important and has been badly analyzed for the last few years. Here is the last decade on the index with the current wedge that is forming. A break to the upside would be good, but to the downside would be most likely devastating and mean that the US economy was badly mismanaged by Congress and the White House:
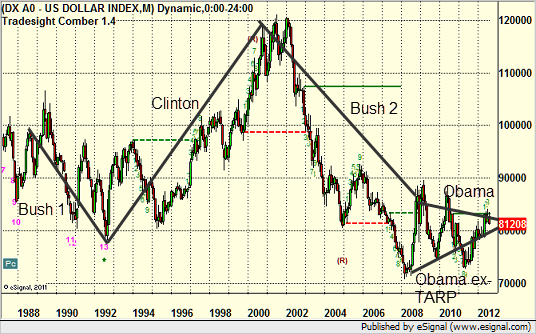
But, we can also back the chart out to the late 1980's and take a look at the history of the US Dollar, which I have commented on many times in the past, especially during election years. What you see is a clear pattern based on Administration policy in the White House:
In old school economics, you want a weaker currency to boost sales of goods you produce when things get weak, but otherwise, you want a stronger currency. The problem is that we don't produce much here anymore, especially after the last decade, so a strong Dollar is the preferred option.
As you can see in the chart above, I take the trendlines from Election Day to Election Day as the change in administration, as I believe that the currency market reacts fairly immediately to perceived policy changes. What I find interesting is that the US Dollar was not something that a network like CNBC commented on much until 2009 when Forex became a popular retail trading tool. Yet, the US Dollar hit a low in the summer of 2008 before TARP was passed, and still, in 2009, the network headlines were about weakness in the US Dollar (which had been killed for the prior 9 years and was actually lower in 2008), and I commented on this in our reports at the time. What the news focuses on and what matters and what is true are rarely the same.
The reality remains that we saw a strong increase in the Dollar based on policy under Clinton, and we saw a collapse of the Dollar based on policy under the last Bush. Under Obama, the trend may be up in general, but it hasn't had the chance to turn enough yet because we get wrapped up in nonsense issues like the Debt Ceiling and long-term debt, when it is the short-term employment issue that is much more damaging (as Bernanke finally seems to have admitted to at Jackson Hole this week).
From a deficit perspective, if you take out TARP and the stimulus and the tax cuts that were enacted in 2001 and 2003 and extended once late in 2010 but will expire later this year if Congress doesn't renew, most of the debt was already realized or comes into place from the tax cuts. The wars, much of which were held "off book" for the middle of the decade but are now counted under the Obama math, don't help. Discretionary spending is way down. We will breakdown the budget itself in a post later in September, but the short version is that there isn't enough to cut in social programs to make a difference. Defense, interest, and social security are the real games, They account for about 75% of the budget. You either cut them back or decide to pay for them, and that's what pulls us off the fiscal cliff (and the reality is that the answer is to do a little of both, and everything will be fine very quickly).
So that is interesting and all, but what does it mean for September 2012 and our trading. Here are a few bullets.
1) Statistically, it should be a down month, but with the Fed hinting at QE3, don't bank on it.
2) Volume should pick up.
3) The election isn't the issue. There are much bigger things holding the market back. Whichever way the election goes, you can expect a tax increase and some spending cuts. If they are to make a difference, the tax increase will have to be bigger than a token amount, and the spending cuts will have to include Defense, the biggest single line-item of annual non-entitlement spending.
4) Anything should be better than August and the bad ranges and tight volume that we experienced there.
But, we call it day by day, and that's why they call it a market. We're happy to have you as subscribers, and I think it should be a good month.
Tradesight Special Market Commentary for September 2012
Summer is ending. This is Labor Day weekend, 2012, and it is the traditional end of summer. This has a lot of implications historically for the stock market.
1) August is typically an up month for the markets, albeit on lighter volume, and we got both. It was a positive month for the indices, but it was particularly weak on volume, and got exceptionally worse in the last week of the month, with NASDAQ volume closing Friday at 1.1 billion shares, down from the much higher numbers around 1.6 billion earlier in the month.
2) September is, historically, the most negative month of the year. In fact, if you take the last 100 years of the stock market and average the returns for each month for 100 years, September is the ONLY month that gives you a negative average return.
3) There is a lot of correlation between that and the Federal fiscal year, which ends at the end of September.
This year, we have a lot of extraordinary events occurring that play a role in the current state of the market. These include, but most likely a not limited to:
1) The situation in Europe and the lack of clarity about one of our biggest trading partners.
2) Signs of a slowdown in China.
3) The Presidential election cycle here in the US.
4) The potential "fiscal cliff" here in the US in 2013 (the point at which, if something isn't done (see below), the country could be in grave financial difficulty).
5) The "Facebook" situation, since the end of May, see below.
These are all factors that play into the markets at this point. To be clear, the economy is not slowing down. If it were, the stock market, would roll to the downside 6-9 months ahead of any correction, as it always has. That isn't the problem. The problem is that NOTHING is occurring. Things aren't getting worse or better. We aren't seeing signs of strength or weakness globally. We don't know if some of the key players are going to fix or make worse their problems. It's a mess, but it is a mess that adds up to sideways action without volume instead of a decline on volume (such as 2008, where we could easily make money on the short side).
So let's tick off these individual points and prepare ourselves for the last third of 2012, and I'll do it without assuming that the end of the world is actually going to happen, as the Mayans predicted.
Let's start with the near-term stuff.
The NDX has set up a brilliant cup and handle breakout this year for the 1400 level, and even if we do get a pullback in September, a turn up at some point in October should lead us to this breakout in the last three months of the year, and the construction is solid enough that it should be meaningful:

With that, the broader market, as measured by the S&P 500, is doing the same:

The old saying is that Banks and Biotechs lead a rally. Banks are doing good, and Biotechs are also strong:

The disappointment is maybe Semiconductors, which aren't at an especially strong point on the charts:

Volume plays a key role in the markets, and it isn't very difficult to analyze what we are seeing. Here is this year to date with a 10-day blue moving average line for volume on the NASDAQ:

What you see is not only that volume dropped off sharply in August, but also that it topped around May 20 (point A), which is TO THE DAY the date that Facebook came public, taking half a trillion dollars of hot trading money and locking it up in a stock.
But the other factor is that August usually sees lighter volume, and then things pick up in September. For example, 2011 (I've drawn a black line along the average volume line for September for each year):

Or 2010:

Or 2009:

2008 isn't as fair because the last plunge from the bank collapse occurred there and so of course volume picked up:

But even if you go back to 2006, you see the same pattern:

It has always been the case that volume dips in August, which is usually a positive month for stocks because the professional short-players are away on vacation, and then volume comes back in September, usually taking the market lower.
The NDX in 2011, the market headed down in September:

The NDX in 2010, the market was UP HUGE in September, so you can't just assume:

In 2008 we were down with the bank collapse:

So it all starts to fit together.
Let's put some of the broader moves in perspective. Here's the NDX going back 10 years with the 2008 banking collapse in the box:

What you can see is that the tech sector has already erased the plunge and gone higher.
Meanwhile, the broader market, which includes the banks, in the same period, has erased the loss but nothing more:

But since we are looking at potential breakouts in both, things seem positive, and another round of Fed easing would help.
What about if we look back further?
Here's the NDX going back to the mid 1990s, and you can see the Y2K liquidity Internet bubble:

The S&P doesn't look as dramatic, and in fact, the Y2K rise and decline matches off with the banking collapse in 2008 and gives us a breakout point to watch for the broad market:

Meanwhile, let's flip the conversation for a minute to the US Dollar Index, which is also important and has been badly analyzed for the last few years. Here is the last decade on the index with the current wedge that is forming. A break to the upside would be good, but to the downside would be most likely devastating and mean that the US economy was badly mismanaged by Congress and the White House:

But, we can also back the chart out to the late 1980's and take a look at the history of the US Dollar, which I have commented on many times in the past, especially during election years. What you see is a clear pattern based on Administration policy in the White House:

In old school economics, you want a weaker currency to boost sales of goods you produce when things get weak, but otherwise, you want a stronger currency. The problem is that we don't produce much here anymore, especially after the last decade, so a strong Dollar is the preferred option.
As you can see in the chart above, I take the trendlines from Election Day to Election Day as the change in administration, as I believe that the currency market reacts fairly immediately to perceived policy changes. What I find interesting is that the US Dollar was not something that a network like CNBC commented on much until 2009 when Forex became a popular retail trading tool. Yet, the US Dollar hit a low in the summer of 2008 before TARP was passed, and still, in 2009, the network headlines were about weakness in the US Dollar (which had been killed for the prior 9 years and was actually lower in 2008), and I commented on this in our reports at the time. What the news focuses on and what matters and what is true are rarely the same.
The reality remains that we saw a strong increase in the Dollar based on policy under Clinton, and we saw a collapse of the Dollar based on policy under the last Bush. Under Obama, the trend may be up in general, but it hasn't had the chance to turn enough yet because we get wrapped up in nonsense issues like the Debt Ceiling and long-term debt, when it is the short-term employment issue that is much more damaging (as Bernanke finally seems to have admitted to at Jackson Hole this week).
From a deficit perspective, if you take out TARP and the stimulus and the tax cuts that were enacted in 2001 and 2003 and extended once late in 2010 but will expire later this year if Congress doesn't renew, most of the debt was already realized or comes into place from the tax cuts. The wars, much of which were held "off book" for the middle of the decade but are now counted under the Obama math, don't help. Discretionary spending is way down. We will breakdown the budget itself in a post later in September, but the short version is that there isn't enough to cut in social programs to make a difference. Defense, interest, and social security are the real games, They account for about 75% of the budget. You either cut them back or decide to pay for them, and that's what pulls us off the fiscal cliff (and the reality is that the answer is to do a little of both, and everything will be fine very quickly).
So that is interesting and all, but what does it mean for September 2012 and our trading. Here are a few bullets.
1) Statistically, it should be a down month, but with the Fed hinting at QE3, don't bank on it.
2) Volume should pick up.
3) The election isn't the issue. There are much bigger things holding the market back. Whichever way the election goes, you can expect a tax increase and some spending cuts. If they are to make a difference, the tax increase will have to be bigger than a token amount, and the spending cuts will have to include Defense, the biggest single line-item of annual non-entitlement spending.
4) Anything should be better than August and the bad ranges and tight volume that we experienced there.
But, we call it day by day, and that's why they call it a market. We're happy to have you as subscribers, and I think it should be a good month.
Stock Picks Recap for 8/31/12
With each stock's recap, we will include a (with market support) or (without market support) tag, designating whether the trade triggered with or without market directional support at the time. Anything in the first five minutes will be considered WITHOUT market support because market direction cannot be determined that early. ETF calls do not require market support, and are thus either winners or losers.
No calls in the report.
From the Messenger/Tradesight_st Twitter Feed, just one call, AMZN triggered short (with market support) and worked great, that was my only trade of the day:
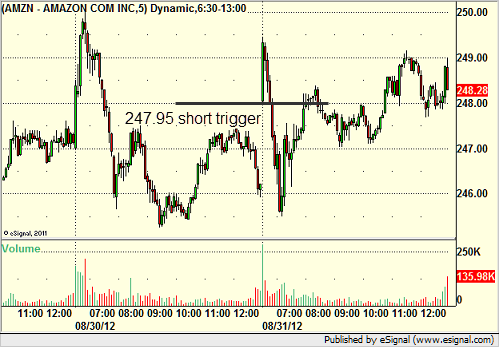
In total, that's 1 trade triggering with market support, and it worked great.
Futures Calls Recap for 8/31/12
One last day without calls due to volume. The movement was a bit better even though volume closed out at 1.1 billion shares because of the Fed comments out of Jackson Hole that whipped the market down and back up for about 20 minutes. Back to work Tuesday finally.
Net ticks: +0 ticks.
As usual, let's start by taking a look at the ES and NQ with our market directional lines, VWAP, and Comber on the 5-minute chart from today's session:


Forex Calls Recap for 8/31/12
A nice winner to close out the week and month. See GBPUSD section below.
As usual on the Sunday report, we will look at the action for Thursday night/Friday, then look at the daily charts heading into the new week (nothing interesting), and then look at the US Dollar Index (something interesting there).
FX Levels will be posted for Sunday but no calls will be made due to the US Holiday. We resume Monday.
Here's a look at the US Dollar Index intraday with our market directional lines:

New calls and Chat tonight after 5 pm EST when the new levels come out after global rollover.
GBPUSD:
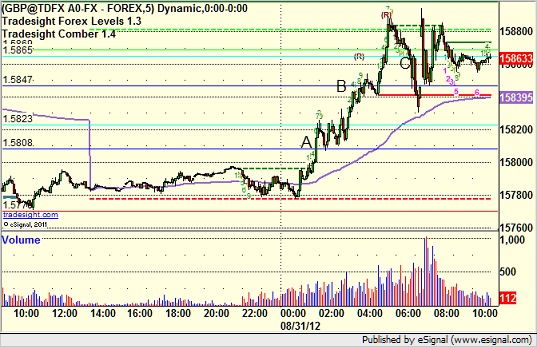
Stopped out of the second half of the prior day's play in the money. Triggered long at A, hit first target at B, closed final piece at C:
