Futures Calls Recap for 5/30/12
Another slow session for futures as the market volume was horrible (NASDAQ volume only 1.5 billion at the close). One winner and two losers as the market looked setup for a nice rally late but fizzled on light volume and did nothing. See ES and NQ sections below.
Net ticks: -11.5 ticks.
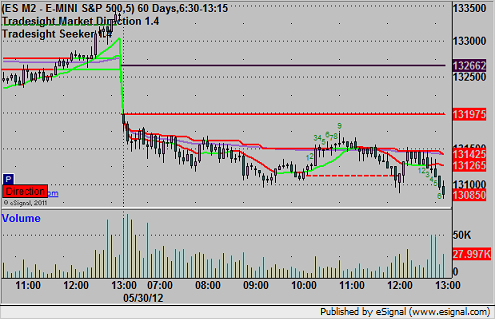
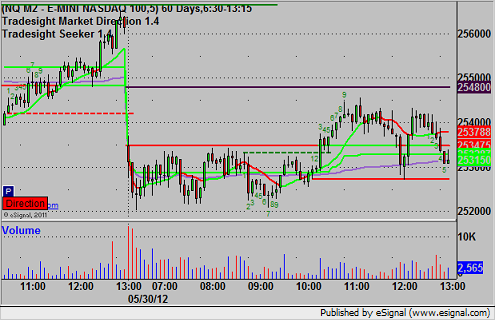
First, let's take a look at the ES and NQ with our market directional tools, plus the Seeker, plus the VWAP:
ES:
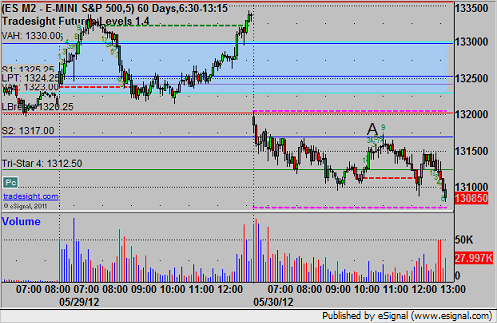
Great setup against S2 for a long in the afternoon, swept the trigger to the tick at A and failed, unfortunately triggered on a 9-bar setup completion as well as the lack of volume:
NQ:
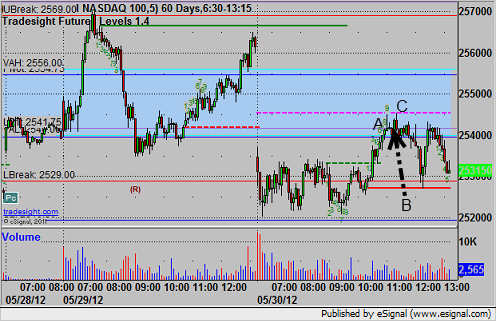
Triggered long above the Lower Pressure Threshold heading into the Value Area at A, stopped for 7 ticks (remember that we use half points for ticks on the NQ). Re-entered at B, hit first target at C, stop goes under the entry and stopped second half, no follow through:
Forex Calls Recap for 5/30/12
An unfortunate session as we were stopped out just barely on a EURUSD trade that ended up working great after. See that section below.
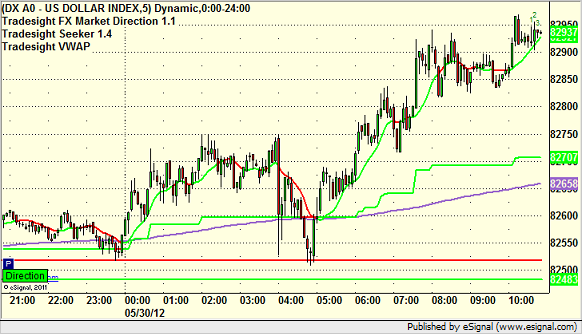
Here's the US Dollar Index intraday with our market directional lines:
New calls and Chat tonight.
EURUSD:
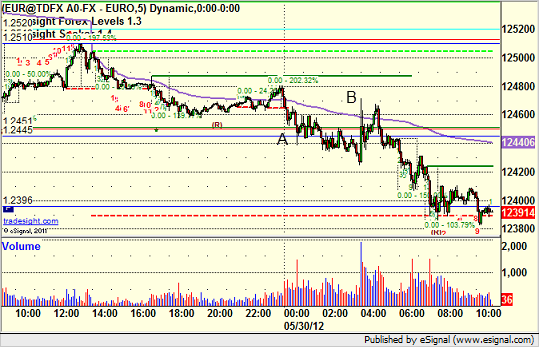
Triggered short at A and then stopped just barely on the spike at B before heading down to where we would have wanted:
Tradesight Market Preview for 5/30/12
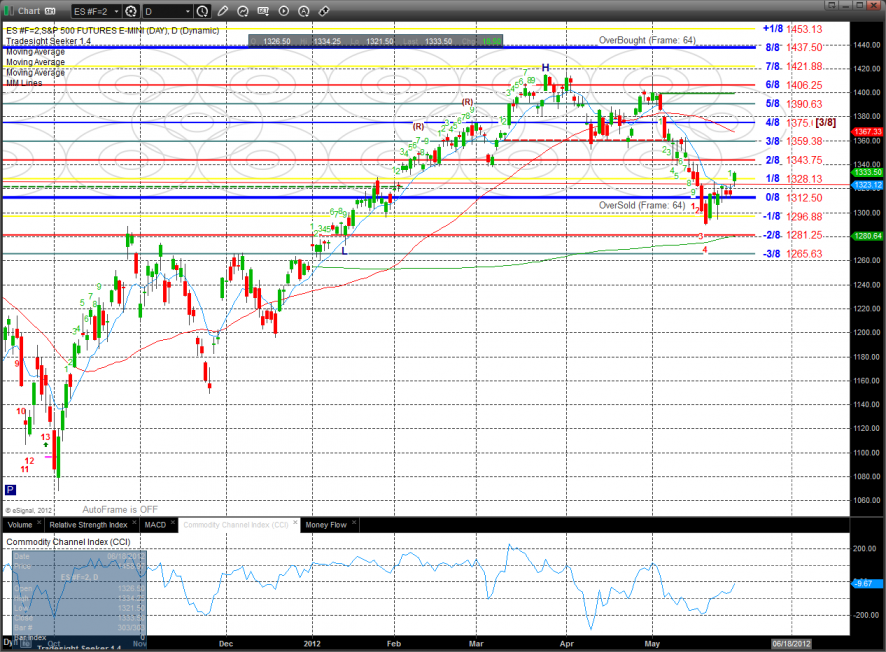
The ES gapped up and gained 18 on the day. This makes the short term chart positive since it has closed back above the 10ema.
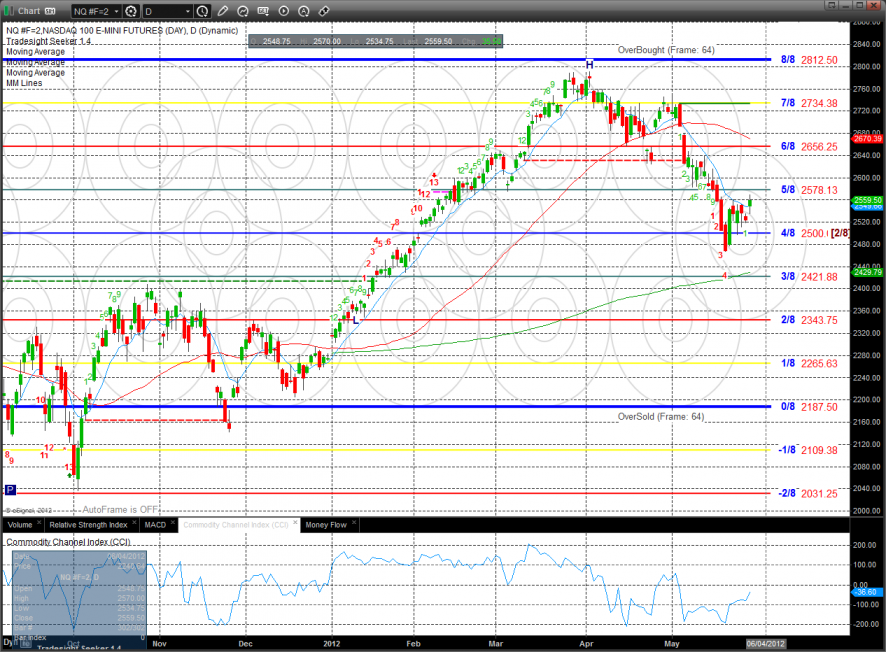
The NQ futures also closed back above the 10ema and turned short term positive. There was some distance from the HOD to the close which is not encouraging to the bulls.
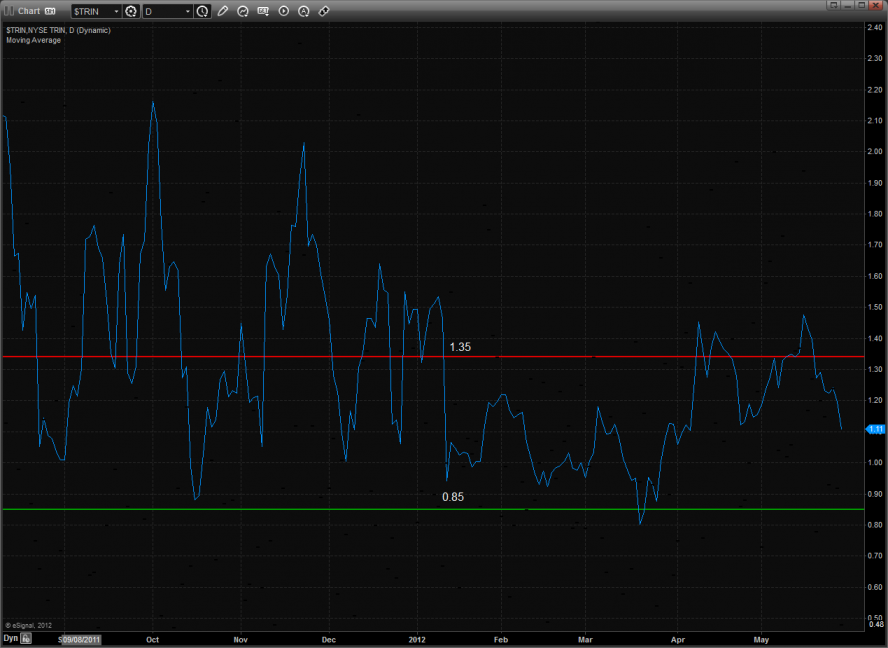
10-day Trin is getting close to the zero baseline.
Multi sector daily chart:
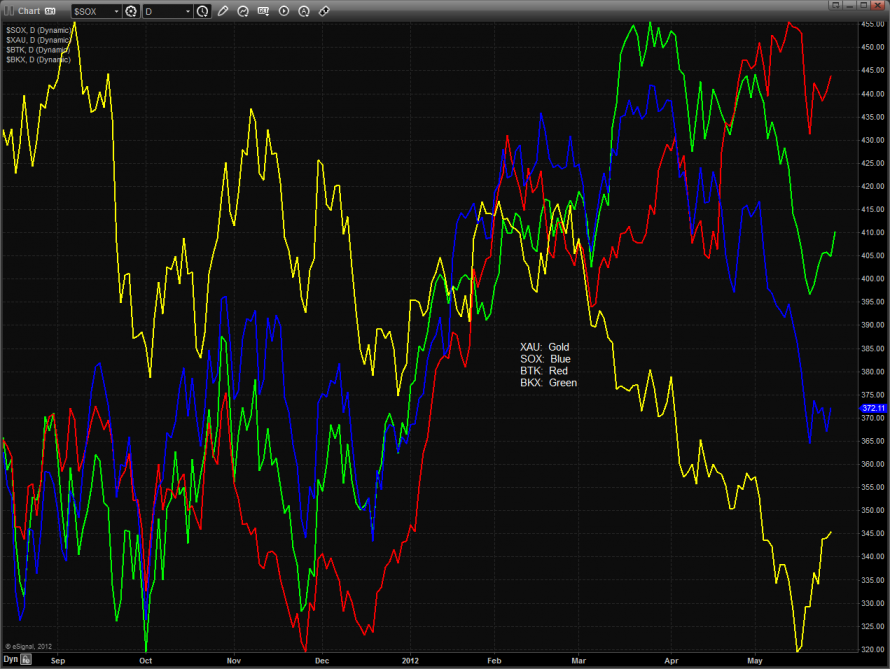
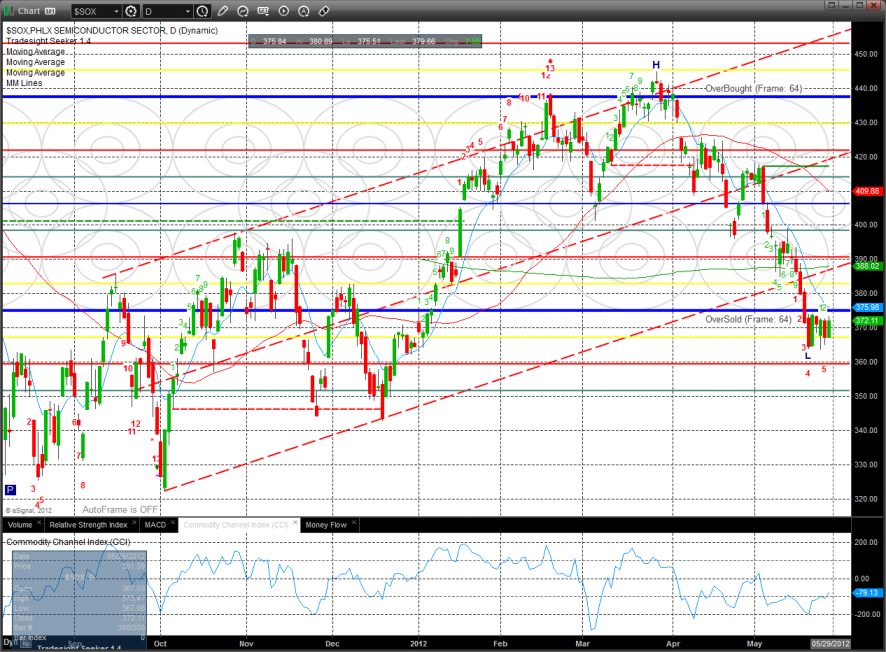
The SOX was strong Tuesday and has turned the relative performance chart for the better. The trend remains down but there is something to build on.
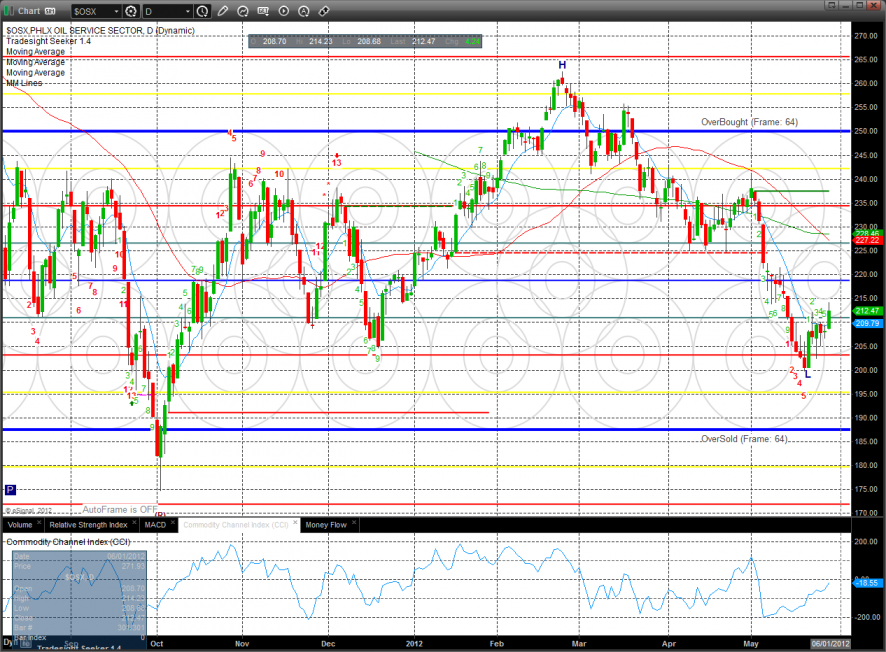
The OSX was the top major index on the day and closed above the 10ema.
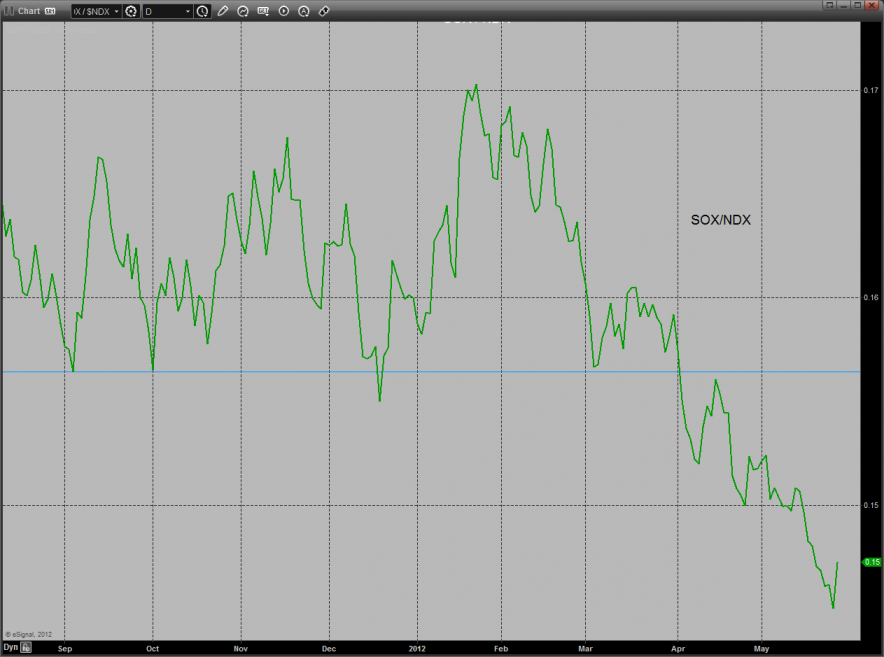
The SOX outperformed the NDX but remains boxed up. Price has been consolidating for a number of days here and should move powerfully once the range is resolved.
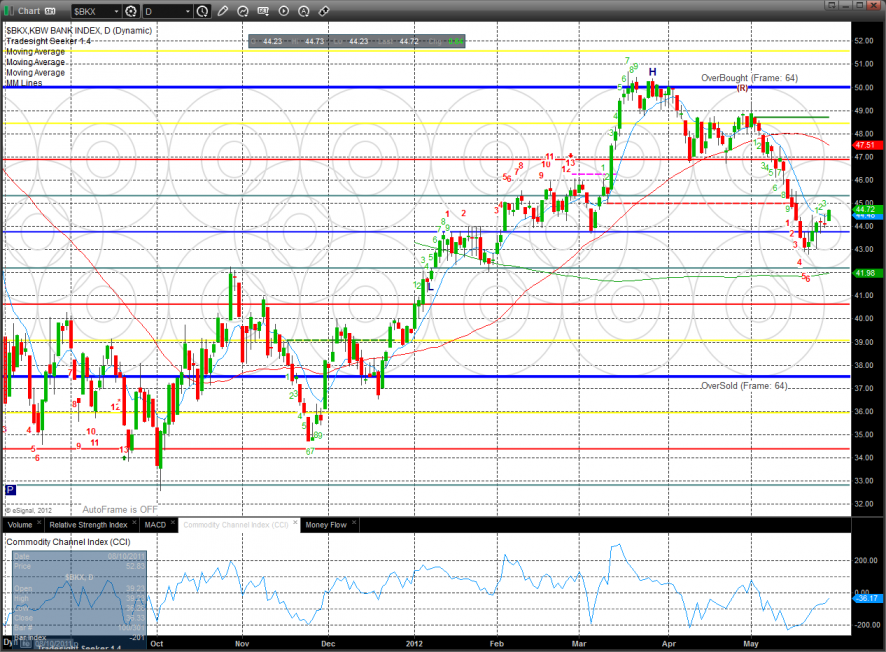
The BKX performed with the broad market.
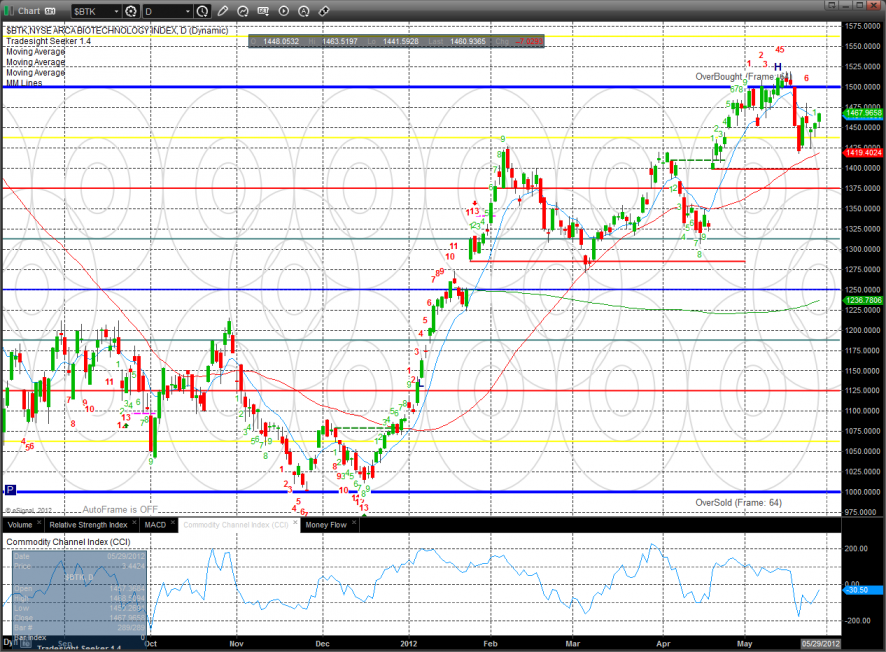
The BTK underperformed the market but did settle back above the 10ema.
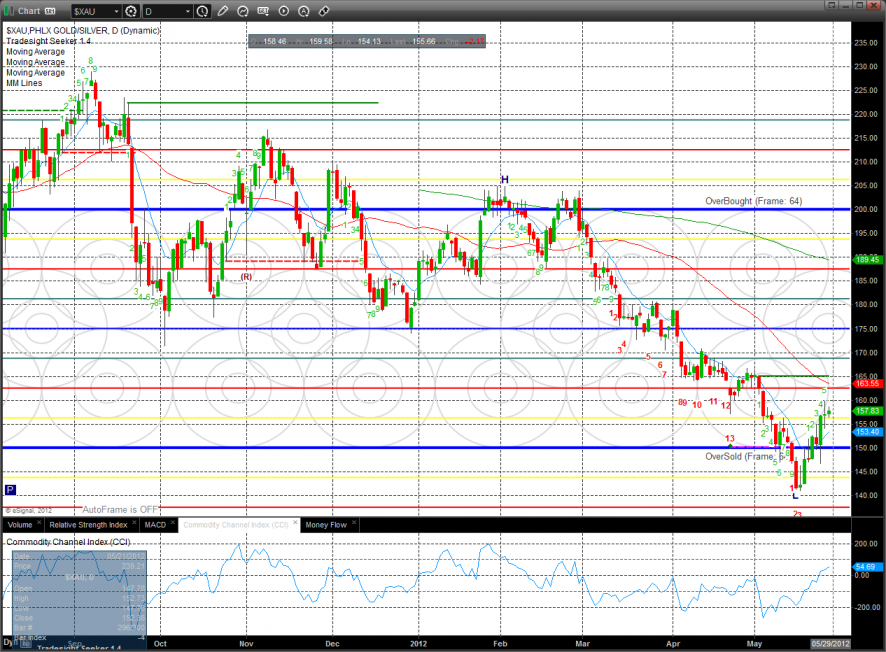
The XAU was the last laggard on the day and was a source of funds along with FB. Yup, I said it.
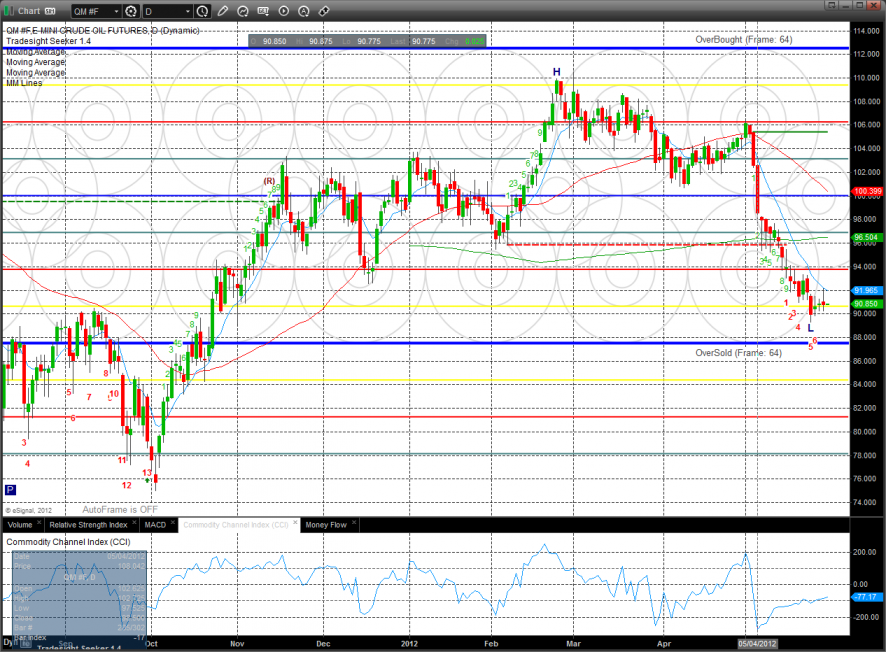
Oil:
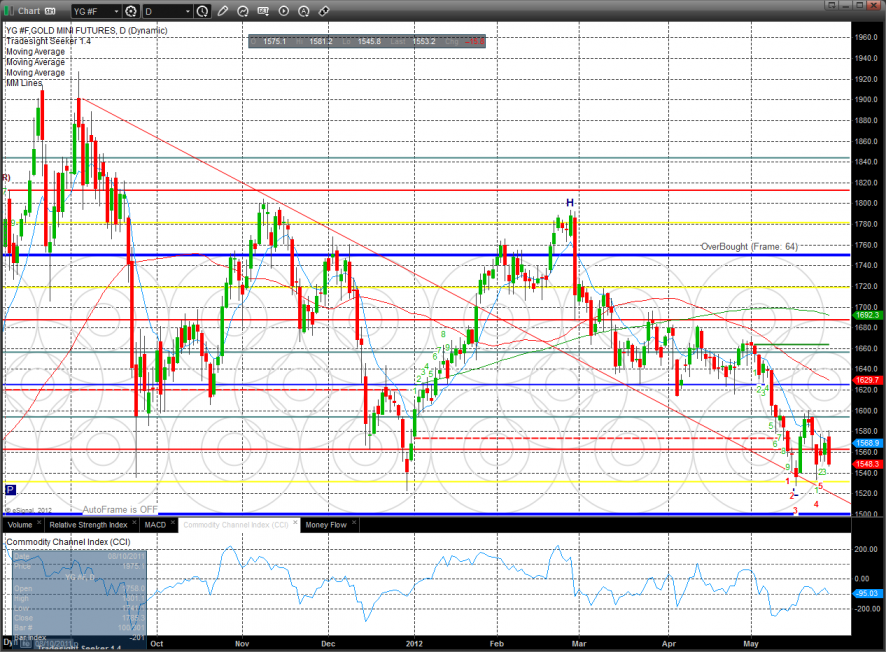
Gold:
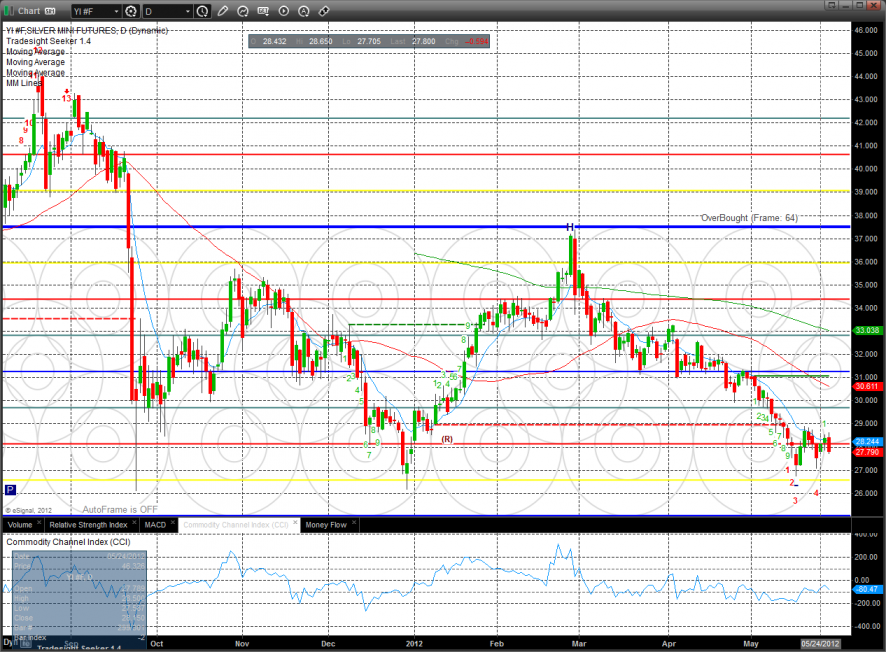
Silver:
Stock Picks Recap for 5/29/12
With each stock's recap, we will include a (with market support) or (without market support) tag, designating whether the trade triggered with or without market directional support at the time. Anything in the first five minutes will be considered WITHOUT market support because market direction cannot be determined that early. ETF calls do not require market support, and are thus either winners or losers.
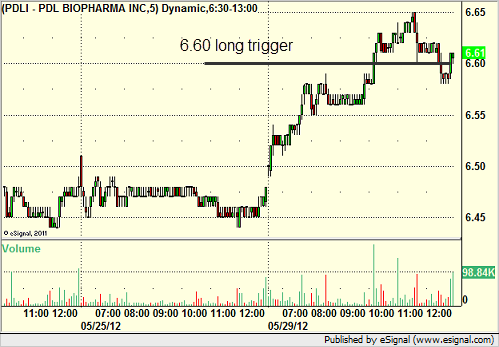
From the report, PDLI triggered long, it's a small cap, hasn't done anything yet, but still holding:
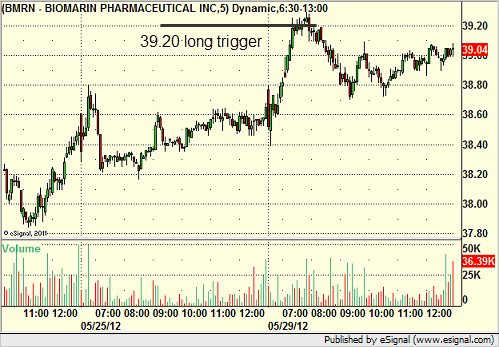
BMRN triggered long (with market support) and didn't work:
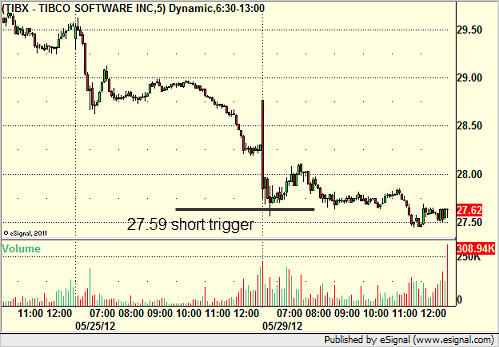
TIBX triggered short (without market support) and didn't work:
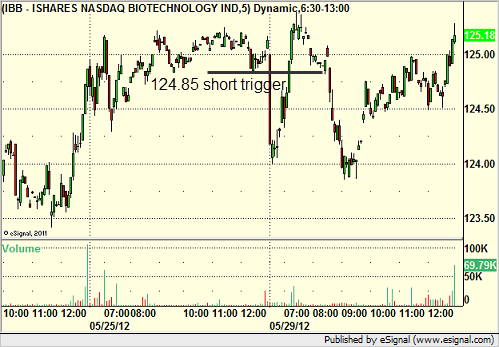
In the Messenger, Rich's IBB triggered short (ETF, so no market support needed) and worked:
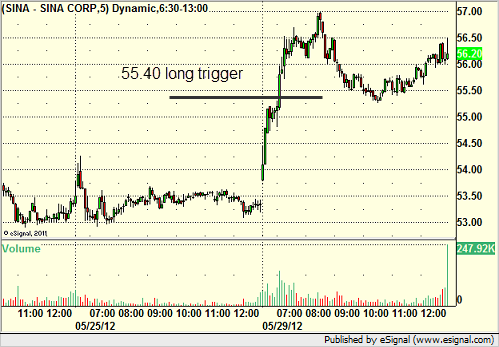
His SINA triggered long (with market support) and worked:
His WYNN triggered long (with market support) and didn't work:
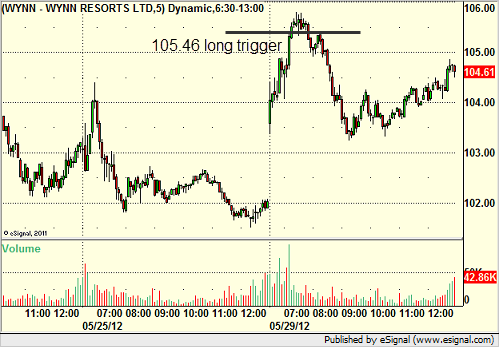
His CAT triggered long (with market support) and worked:

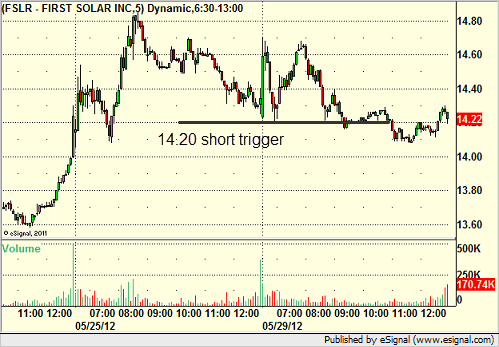
FSLR triggered short (with market support) and didn't go a dime in either direction, so we don't count it:
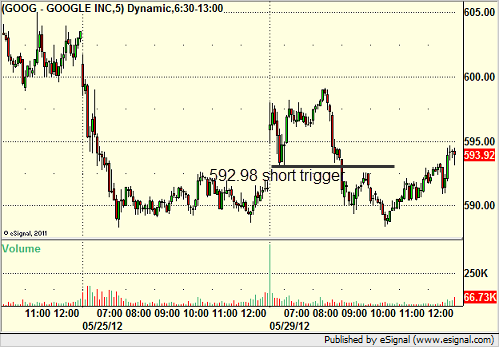
GOOG triggered short (with market support) and worked:
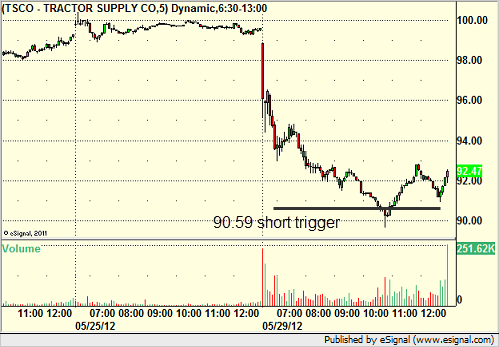
TSCO triggered short (with market support) and worked enough for a partial:
VRTX triggered long (without market support) and didn't work:
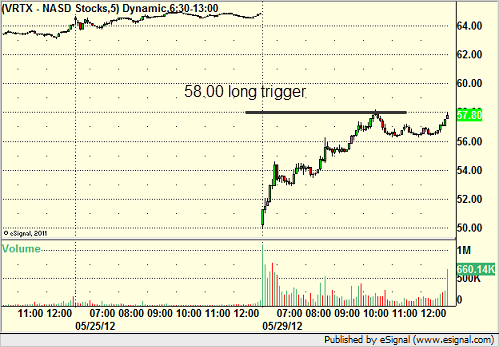
In total, that's 7 trades triggering with market support, 5 of them worked, 2 did not.
Futures Calls Recap for 5/29/12
A very light volume day as expected. Two losers (ES) and a winner (NQ), see both sections below.
Net ticks: -11.5 ticks.
First, let's take a look at the ES and NQ with market directional lines, VWAP, and our Seeker tool:


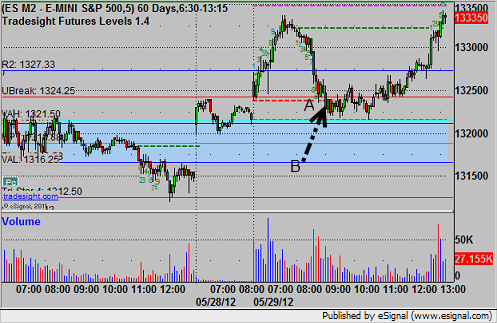
ES:
Triggered short by a tick at A (note that it was 9-bars down at that point) and stopped for 7 ticks. Went again at B and actually stopped before it proceeded and worked, but that retrigger was two fast (entered, stopped within 2 minutes, triggered again a minute later, so too fast for most):
NQ:
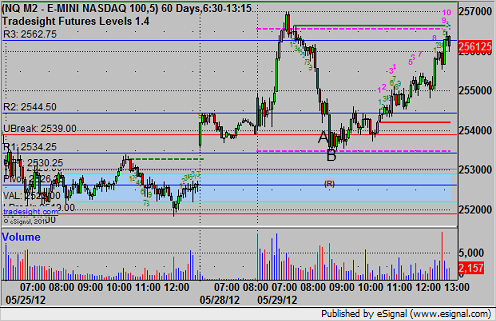
Triggered short at A, hit first target for 6 half-point ticks at B, stopped over entry the second half:
Futures Calls Recap for 5/29/12
A very light volume day as expected. Two losers (ES) and a winner (NQ), see both sections below.
Net ticks: -11.5 ticks.
First, let's take a look at the ES and NQ with market directional lines, VWAP, and our Seeker tool:


ES:
Triggered short by a tick at A (note that it was 9-bars down at that point) and stopped for 7 ticks. Went again at B and actually stopped before it proceeded and worked, but that retrigger was two fast (entered, stopped within 2 minutes, triggered again a minute later, so too fast for most):

NQ:
Triggered short at A, hit first target for 6 half-point ticks at B, stopped over entry the second half:

Forex Calls Recap for 5/29/12
Not much action early despite coming back from a long weekend, but then things started moving in the US session. See EURUSD below.
Here's the US Dollar Index intraday with our market directional lines:

New calls and Chat this evening.
EURUSD:
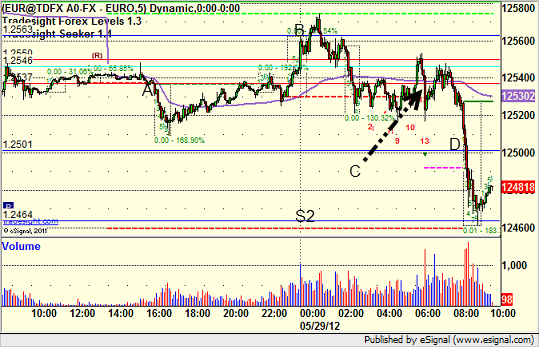
Triggered short at A and stopped. Triggered long at B and stopped. Triggered short in the morning again at C, hit first target at D, then hit S2 and currently holding the second half with a stop over S1:
Forex Calls Recap for 5/29/12
Not much action early despite coming back from a long weekend, but then things started moving in the US session. See EURUSD below.
Here's the US Dollar Index intraday with our market directional lines:

New calls and Chat this evening.
EURUSD:
Triggered short at A and stopped. Triggered long at B and stopped. Triggered short in the morning again at C, hit first target at D, then hit S2 and currently holding the second half with a stop over S1:

The Magic Number on the ES: 1312.50
Let's talk a little bit about the cosmic importance of the number 1312.50 on the ES front month futures contract. This level, what we call a tri-star level, has been a magnet point for the market many times in the last 13 (yes, 13) years.
We consider tri-star levels to be key points that the market has touched many times from above and below. Typically, once the market approaches a tri-star level, it is drawn to it like a magnet. The 1312.50 is one of the most used of the tri-star levels. Let's have a look.
Here is a monthly chart of the ES front month futures contract going back to the late 1990's:
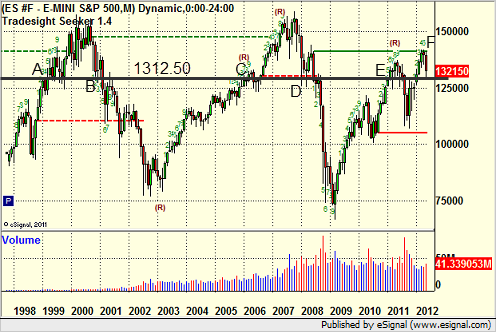
Those of us that have been trading a while remember the level dominated the market throughout much of 1999. The level was first hit in January of that year (point A on the chart above), and it was touched in 8 of the 12 months of that year, but even more interesting was how often the level was used intraday throughout the year. The market accelerated up in late 1999 for the Y2K run-up, then came back to the 1312.50 level on the way down during the liquidity unwind that occurred after, hitting the level again late in 2000 (point B) and then using it from both sides over the next six months. We wouldn't see the level again until 2006 at point C, but then again, we played around that area for months. In 2008, on the way back down, 1312.50 was support twice (D) and then used for several months again.
In the process of QE1 and QE2 and the economic recovery that has been occurring slowly since 2009, the market made its way back to the level in early 2011 at point E. The number came up over and over in our trading throughout 2011. The market then reached up to a key "Static Trendline" on the monthly chart (the green line at F), found resistance there, and then made it's way back to 1312.50 this last month.
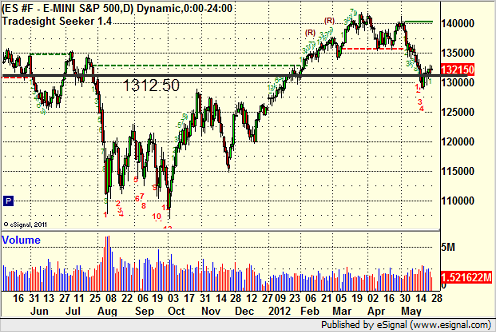
Zooming into a daily chart of the last year, you can get a better feel for how momentum swings the market around this level like a magnet each time it comes into range:
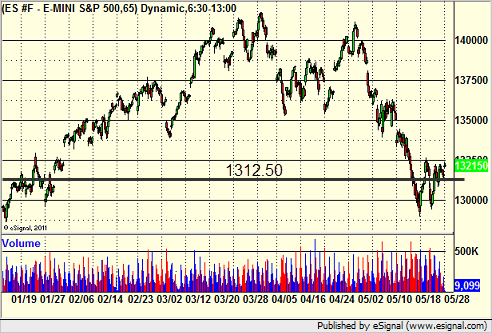
That view gets even more interesting when you scale down to a 65-minute chart (6 equal bars per day), as you can clearly see that each time the market reaches this area, it plays around it for a few days:
Now, let's zoom in one final time to a 5-minute chart, which will give us the most clarity about the importance of this level. After the market rallied up and hit the Static Trendline on the monthly chart that I showed above, we had reached as high as 1360. In the middle of May, the market headed sharply lower, dropping over 40 points in five days, ending with a bounce off of the 1312.50 level on May 17 at point A on this chart:
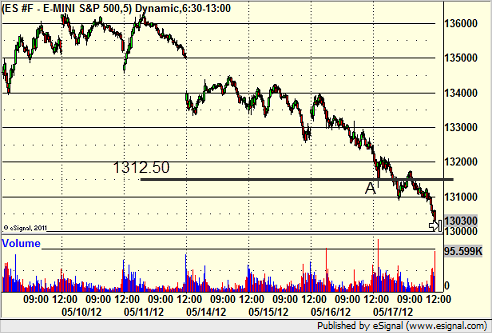
So in a decline in the market of over 40 points in a handful of days, the market was drawn straight to 1312.50, and then got a small bounce before recoiling and breaking under that level. What have we seen in the 7 days since then? Have a look:
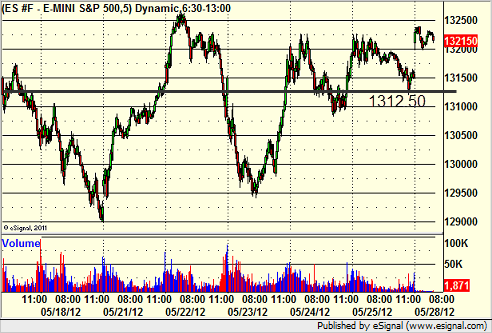
Just about every single day (except May 18) has touched the level. In fact, it's basically the mid-point of this period, and the swings around it have gotten smaller and smaller as the market sticks even more to the tri-star level. In fact, in the last hour of Friday's light-volume action heading into this Memorial Day weekend, the market looked like it might even close right at that level. There would have been some irony in closing at the number that the market has remembered most over the last 13 years for Memorial Day.
Be aware of these key tri-star levels (there are others) as a lot can be learned from monitoring the market behavior around them.
The Magic Number on the ES: 1312.50
Let's talk a little bit about the cosmic importance of the number 1312.50 on the ES front month futures contract. This level, what we call a tri-star level, has been a magnet point for the market many times in the last 13 (yes, 13) years.
We consider tri-star levels to be key points that the market has touched many times from above and below. Typically, once the market approaches a tri-star level, it is drawn to it like a magnet. The 1312.50 is one of the most used of the tri-star levels. Let's have a look.
Here is a monthly chart of the ES front month futures contract going back to the late 1990's:

Those of us that have been trading a while remember the level dominated the market throughout much of 1999. The level was first hit in January of that year (point A on the chart above), and it was touched in 8 of the 12 months of that year, but even more interesting was how often the level was used intraday throughout the year. The market accelerated up in late 1999 for the Y2K run-up, then came back to the 1312.50 level on the way down during the liquidity unwind that occurred after, hitting the level again late in 2000 (point B) and then using it from both sides over the next six months. We wouldn't see the level again until 2006 at point C, but then again, we played around that area for months. In 2008, on the way back down, 1312.50 was support twice (D) and then used for several months again.
In the process of QE1 and QE2 and the economic recovery that has been occurring slowly since 2009, the market made its way back to the level in early 2011 at point E. The number came up over and over in our trading throughout 2011. The market then reached up to a key "Static Trendline" on the monthly chart (the green line at F), found resistance there, and then made it's way back to 1312.50 this last month.
Zooming into a daily chart of the last year, you can get a better feel for how momentum swings the market around this level like a magnet each time it comes into range:

That view gets even more interesting when you scale down to a 65-minute chart (6 equal bars per day), as you can clearly see that each time the market reaches this area, it plays around it for a few days:

Now, let's zoom in one final time to a 5-minute chart, which will give us the most clarity about the importance of this level. After the market rallied up and hit the Static Trendline on the monthly chart that I showed above, we had reached as high as 1360. In the middle of May, the market headed sharply lower, dropping over 40 points in five days, ending with a bounce off of the 1312.50 level on May 17 at point A on this chart:

So in a decline in the market of over 40 points in a handful of days, the market was drawn straight to 1312.50, and then got a small bounce before recoiling and breaking under that level. What have we seen in the 7 days since then? Have a look:

Just about every single day (except May 18) has touched the level. In fact, it's basically the mid-point of this period, and the swings around it have gotten smaller and smaller as the market sticks even more to the tri-star level. In fact, in the last hour of Friday's light-volume action heading into this Memorial Day weekend, the market looked like it might even close right at that level. There would have been some irony in closing at the number that the market has remembered most over the last 13 years for Memorial Day.
Be aware of these key tri-star levels (there are others) as a lot can be learned from monitoring the market behavior around them.
