Forex Calls Recap for 4/9/12
Half size night for me as I said in the opening comments as Europe was entirely on vacation for Easter, even though the US was not. Basically got what we should have expected out of such a session.
Here's the US Dollar Index intraday with market directional lines:

New calls tonight and hopefully back to work with the world open.
EURUSD:
All trades were half size. Triggered short at A and stopped (note the 13 for a bottom). Triggered short at B and stopped:

GBPUSD:
Triggered long at A, closed at B at entry as we ran out of time:

A Discussion of Forex Ranges
I get a lot of questions about the bad ranges that we are experiencing in Forex right now and what that means and whether the Forex market is now dead forever because of the regulations that have come about in the last few years, some of which protect consumers, but others cut leverage and do things that some people believe affect the market negatively in terms of range.
Let me start by shooting down those theories.
1) All markets have dull periods and wild periods.
2) The Forex market moves based on global economic events and money flows. Just because the average retail daytrader can now only trade on 50:1 leverage instead of 100:1 doesn't mean that the EURUSD can't move. In fact, it will.
I hope by the end of this article, you'll see that.
We track what we call "Average Daily Range" in the Forex pairs. Basically, we're looking at the last six months of data on each pair. A "day's range" is the high minus the low of the day. So let's take the EURUSD. If the high is 1.3164 and the low is 1.3035 on a day (which it was Wednesday at 5 pm to Thursday at 5 pm EST), that's 129 pips of range for the day. We then take that number for the last six month's of trading days, add up the ranges, and divide by the number of trading days. This tell us the six month average.
It is VERY important to use 6 months and not less in these calculations. First of all, we use them as a trading support and resistance point when hit each day, and our research and backtesting showed that if you used less data, such as 2-3 months, the number swung more wildly and wasn't used by the market. Anything over 6 months seems to have diminishing returns in terms of practical use.
So at this moment, the EURUSD 6 month ADR is 139 pips. That's down from 168 pips, which was the 6 month trailing ADR at the end of 2011, just a mere three months ago. What does that mean in practical application? It means that in those three months, we saw a lot of days well under 139 pips that have brought the number down.
We make way more money when the market moves under our system, so lower ranges generally mean a few things:
1) Higher chance of stopping out of a trade
2) Less chance that even if a trade is profitable, it goes far or turns into a big winner
So, what's the net importance? Periods of bad ranges mean lesser results from our trading. We're going to make the most money when the ranges are good.
Now that we understand that dynamic, obviously it becomes important to know whether the Forex market is truly seeing worse ranges forever and is in a permanent decline or not. Even though the movement of the market is not about the leverage factor or how much retail money goes into daytrading, that seems to be a discussion among daytraders (who seem to give themselves too much credit for being the primary factor of market movement).
So let's look at this graphically and see if we should be concerned.
Here are the last 12 months in the EURUSD, and I choose this because it is the most commonly traded pair:

I've boxed in two periods of a couple of months or so where the movement was limited, and thus the average daily ranges in there were smaller, bringing down the averages. Now, let me point out that even at the end of that first box, which is around September 1, 2011, the 6-month average range on the EURUSD was still 155 pips. So basically, even though there are 2-3 months of fairly flat activity there, the average for the first half or so of 2011 was 155, which is still 16 pips better than the current 139, and believe me, 16 pips off of a SIX MONTH average is a big deal. But, as I've already said, even after that cycle, we were back up to 168 pips on the average by the end of 2011.
2-3 months at a time of narrow ranges happens in Forex. It usually happens at least once a year. Also, a common time is July/August when the world is on summer break, especially out of Europe. Big decisions aren't being made. Note that that first box in the chart above ended at the end of August, and remember that as we start going backward in time in a few paragraphs.
Now, let's look at the same chart (last 12 months on the EURUSD) with boxes drawn around periods of good movement, which also raises average ranges by definition (it would be rare for the market to move over the course of a month in one direction fairly well, but for the range of each day to get worse in the course of that move):

What do we see here? I would say last May and into June had good range, and September through the end of January in general did, although I put a secondary box around three flat weeks, which was the end of year Holidays (also common, but you'll see soon, not always the case).
If you go back and look at our results, we had some killer months in there. But those summer months were awful, and the current environment is even worse based on the ADR being 139 pips. And while it doesn't correlate exactly, note that the EURUSD is exactly here at the start of April where it was at the start of October, six months ago.
Next, let's start going back in time year by year, showing the full calendar year, starting with 2010, with boxes drawn around the periods where trading was good and ranges were good. That means that the areas between the boxes were dull. Here's 2010:

What we see here is that mid-February through mid-April was boring, most of August was boring (on average, it's the slowest month of the year), and December was slow, especially the back half (nothing unusual). So I would call 2010 a good year that saw less slow periods, and certainly nothing extended for more than about 6-8 weeks. The EURUSD cover 2500 pips that year.
2009:

2500 pips from high to low again, most of it in one direction. Three solid months (12 weeks) of doldrums in the summer. End of the year wasn't bad. The funny thing here is that even with the movement, since July and August were so slow and the rest of the back half of the year wasn't too wild, the ADR on the EURUSD at the end of the year was 132 pips...LOWER than it is right now!
By the way, you can log into our site and go to Forex Levels and go back to any date you want and see what the 6-month trailing ADR was at that time.
2008:

A great trading year. Some slowness in November for 4 weeks, and yet, still, we had a bad period from April through mid-July (strangely, the rest of July and August were great, so never STOP trading just because you hit August). The main point, though is that we saw a full 3 months of bad activity in 2008 also. I'm going to surprise you with the EURUSD ADR at the end of 2008 in a few paragraphs.
2007:

Another great trading year. Nothing to complain about except that period from mid-April to mid-June. This is really a dream year for traders. Trust me, there were no points where people were whining about the ranges being bad.
But here's where the real point comes in. 2006:

While the back end of the year (starting the weekend of Thanksgiving if you were here and remember) and into 2007 were great, the prior 6-7 MONTHS were awful. The bulk of trading for that whole period was almost in a 200 pip range. I like days that hit that in a single session!
Trust me, everyone back then was proclaiming the death of Forex, which had really only come into the public eye about 4-5 years prior. People were saying "Everyone is trading Forex now, so the market can't move" and "Now they are going to regulate it and ruin it." Stuff like that. I had started trading Forex in 2005, but then again, I have been trading markets since 1989, so slow periods, I know, are part of the game, and we said that here at Tradesight at the time. Note the comment above the box on that 2006 chart. The ADR on the EURUSD on Thanksgiving Day 2006 was 91 pips! Today, we're still at 139. And between here and there, scroll up and look back through all of those years and see all of the movement.
And then here's the real doozy. What was the EURUSD ADR on December 31, 2008? 227 PIPS. That's not a typo. Why? A little thing called the banking collapse of 2008. The markets went crazy...all markets.
So remember, in late 2006, everyone was proclaiming the death of Forex trading. Look at how 2007 went and 2008, and think about the change in ranges from that dull six month period in 2006 to the peak at the end of 2008 (227 pips of ADR is almost not tradeable from the other perspective...too much fast movement equals too much risk).
The driving factor of Forex isn't regulation of the retail trading houses or lower leverage for the retail trader. It's global economic forces, and believe me, maybe right this moment, with interest rates near zero globally and the problems we are still experiencing here from the real estate bust and banking collapse and the issues of debt in Europe...it's a little bit frozen. But those are the reasons, and at some point, one way or another, something's going to break. Could be a collapse of a country or someone starting to grow. Either one will get things moving.
Having said all of that, that's why we trade stocks and futures here as well. They have trading just great even as Forex has gotten a little slow the last few months. But I don't expect to go all the way through 2012 without some better periods for Forex too.
Have a great weekend.
Tradesight March 2012 Forex Results
Before we get to March’s numbers, here is a short reminder of the results from February. The full report from February can be found here and you can get the last several months in a row vertically by clicking here and scrolling down.
Tradesight Pip Results for February 2012
Number of trades: 30
Number of losers: 13
Winning percentage: 56.7%
Worst losing streak: 3 in a row (start of the month)
Net pips: +70
Reminder: Here are the rules.
1) Calls made in the calendar month count. In other words, a call made on August 31 that triggered the morning of September 1 is not part of September. Calls made on Thursday, September 30 that triggered between then and the morning of October 1 ARE part of September.
2) Trades that triggered before 8 pm EST / 5 pm PST (i.e. pre Asia) and NEVER gave you a chance to re-enter are NOT counted. Everything else is counted equally.
3) All trades are broken into two pieces, with the assumption that one half is sold at the first target and one half is sold at the final exit. These are then averaged. So if we made 40 pips on one half and 60 on the second, that’s a 50-pip winner. If we made 40 pips on one half, never adjusted our stop, and the second half stopped for the 25 pip loser, then that’s a 7 pip winner (15 divided by 2 is 7.5, and I rounded down).
4) Pure losers (trades that just stop out) are considered 25 pip losers. In some cases, this can be a few more or a few less, but it should average right in there, so instead of making it complicated, I count them as 25 pips.
5) Trade re-entries are valid if a trade stops except between 3 am EST and 9 am EST (when I’m sleeping). So in other words, even if you are awake in those hours and you could have re-entered, I’m only counting things that I would have done. This is important because otherwise the implication is that you need to be awake 24/6. Triggers that occur right on the Big Three news announcements each month don’t count as you shouldn’t have orders in that close at that time.
You can go through the reports and compare the breakdown that I give as each trade is reviewed.
Tradesight Pip Results for March 2012
Number of trades: 33
Number of losers: 17
Winning percentage: 48.5%
Worst losing streak: 3 in a row (around the 6th)
Net pips: +100
The Forex markets continue to exhibit narrower than preferred ranges, which makes for poor trading opportunities. We only had one trade the whole month, I believe, where the final exit was more than 100 pips in the money. However, with good trade management, we still ended up ahead, and actually outperformed February despite lower win ratio. The good news is that it didn't come down to any one big trade, where if you missed it, it ruined your month. The bad news is that these narrow ranges, which I will discuss in a separate blog over the weekend, continue to disappoint Forex traders (fortunately, futures and stocks have had great weeks).
What is really remarkable here is that the six month AVERAGE daily ranges dropped quite a bit further in March than where they were in February. The EURUSD dropped it's average 13 pips to 141 pips per day over the last six months. That's a big drop when thinking about an average. Really happy that we survived the way that we did. GBPUSD dropped about 7 pips off its trailing six month average too. The only thing steady is the USDJPY, which sadly only trades about 57 pips per day on average since the earthquake last year. The AUDUSD and NZDUSD also dropped about 10 pips on average during the month.
Stock Picks Recap for 4/5/12
With each stock's recap, we will include a (with market support) or (without market support) tag, designating whether the trade triggered with or without market directional support at the time. Anything in the first five minutes will be considered WITHOUT market support because market direction cannot be determined that early. ETF calls do not require market support, and are thus either winners or losers.
From the report, ARQL triggered long (with market support) and didn't do enough either way to count:

In the Messenger, Rich's BBBY triggered long (with market support) and didn't work the first time (worked the second):

His SHLD triggered long (with market support) and worked enough for a partial:

TEVA triggered long (with market support) and worked enough for a partial:

Rich's AGQ triggered long (ETF) and worked:

His LULU triggered long (with market support) and worked:

In total, that's 5 trades triggering with market support, 4 of them worked, 1 did not.
Forex Calls Recap for 4/5/12
A partial stop out and a nice winner to wrap the short week. See EURUSD below.
Here's the US Dollar Index intraday with our market directional lines:

We will post Levels tonight for those that wish to trade, but there will be no calls due to the US Holiday on Friday. NFP comes out in the morning, so be careful.
EURUSD:
Part of a trade triggered long at A and stopped. Then the full trade triggered short at B, hit first target at C, lowered stop in the morning and closed final piece at D for 50 pips:

Forex Calls Recap for 4/5/12
A partial stop out and a nice winner to wrap the short week. See EURUSD below.
Here's the US Dollar Index intraday with our market directional lines:

We will post Levels tonight for those that wish to trade, but there will be no calls due to the US Holiday on Friday. NFP comes out in the morning, so be careful.
EURUSD:
Part of a trade triggered long at A and stopped. Then the full trade triggered short at B, hit first target at C, lowered stop in the morning and closed final piece at D for 50 pips:

Tradesight.com Market Preview for 4/5/12
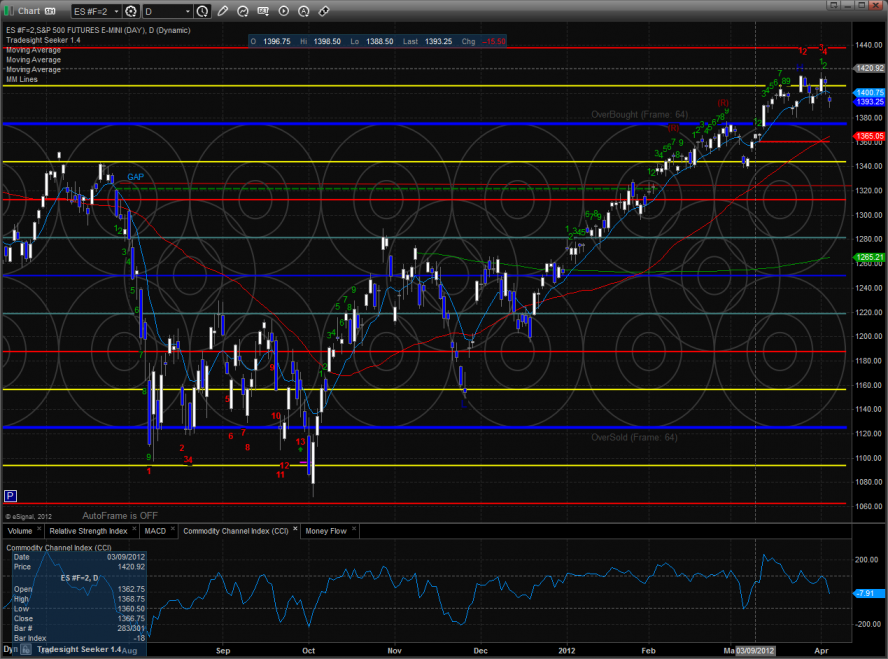
The ES gapped down below the lower pressure threshold and could not recover. Price lost 15 on the day and settled below the 10ema.
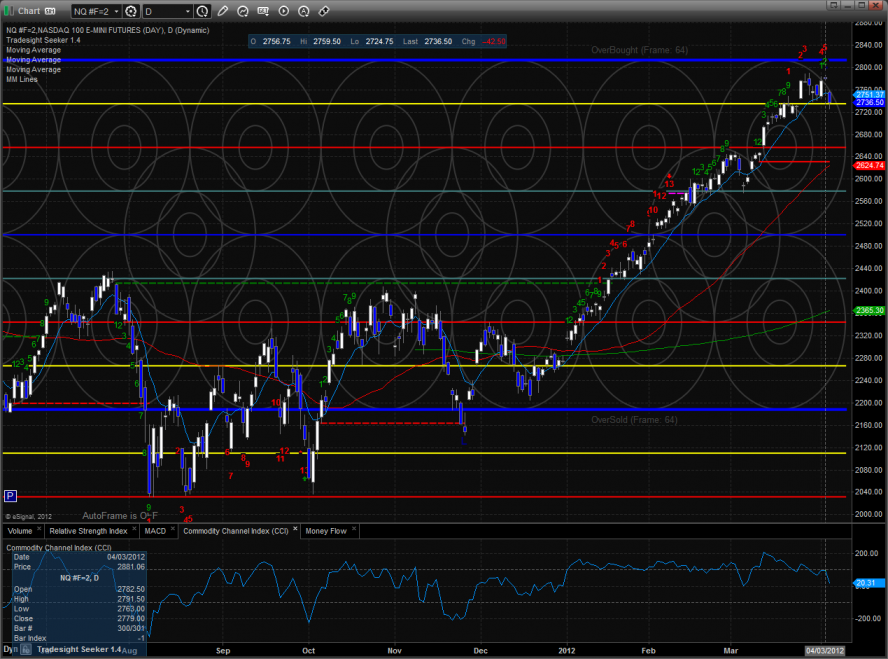
The NQ futures broke below the recent range and decisively settled below the trend defining 10ema. A follow through day would turn the chart short-term negative.
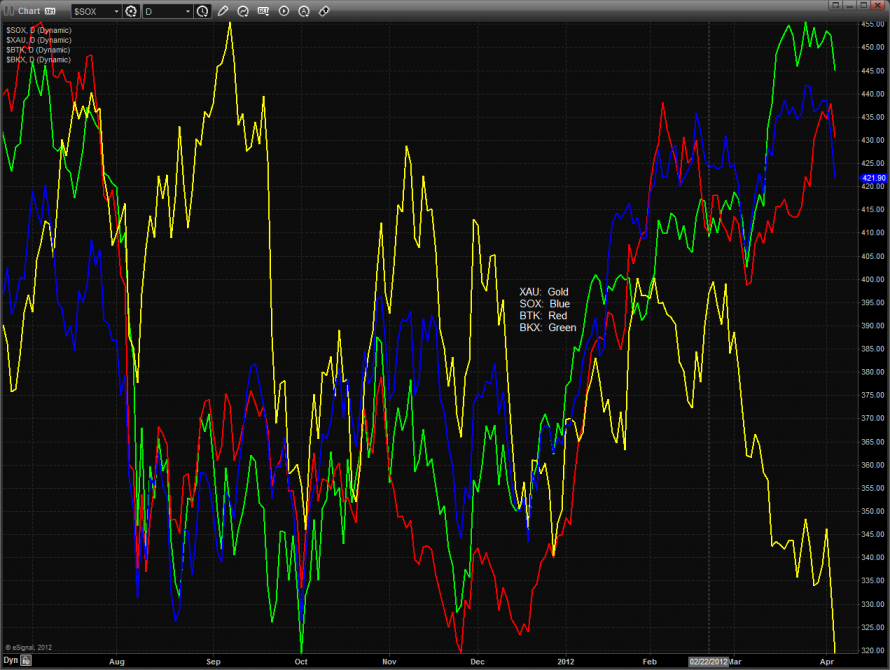
Multi sector daily chart:
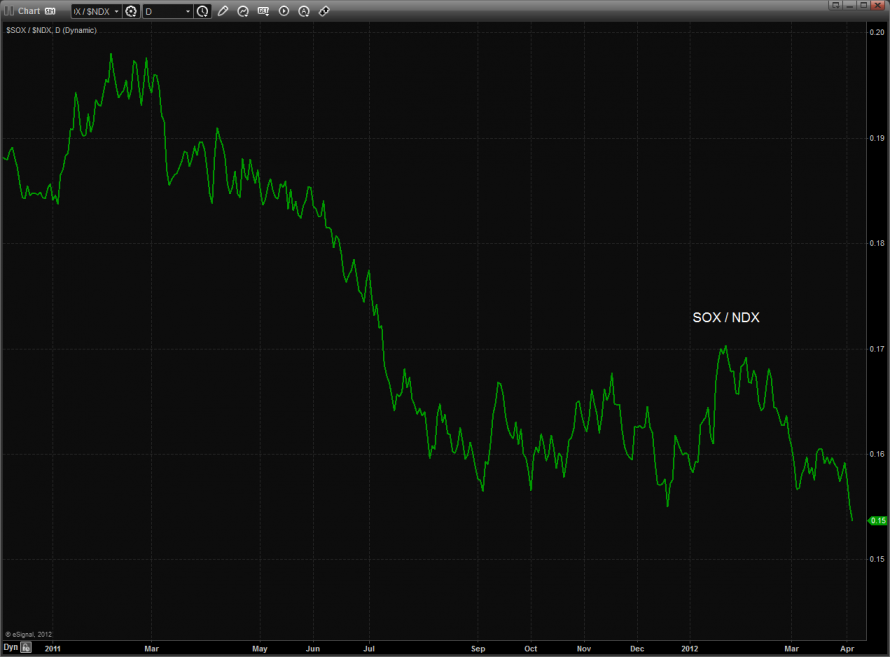
The SOX/NDX cross bearishly made a new low on the move which has negative implications for the overall NDX.
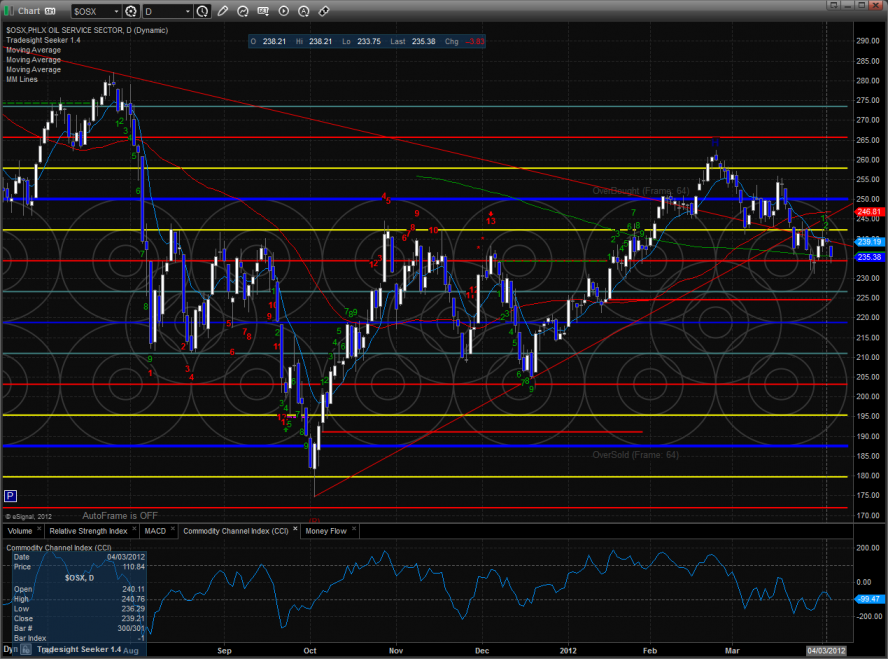
The OSX was the best performing sector on the day managing to hover above the real breakdown level below the March lows.
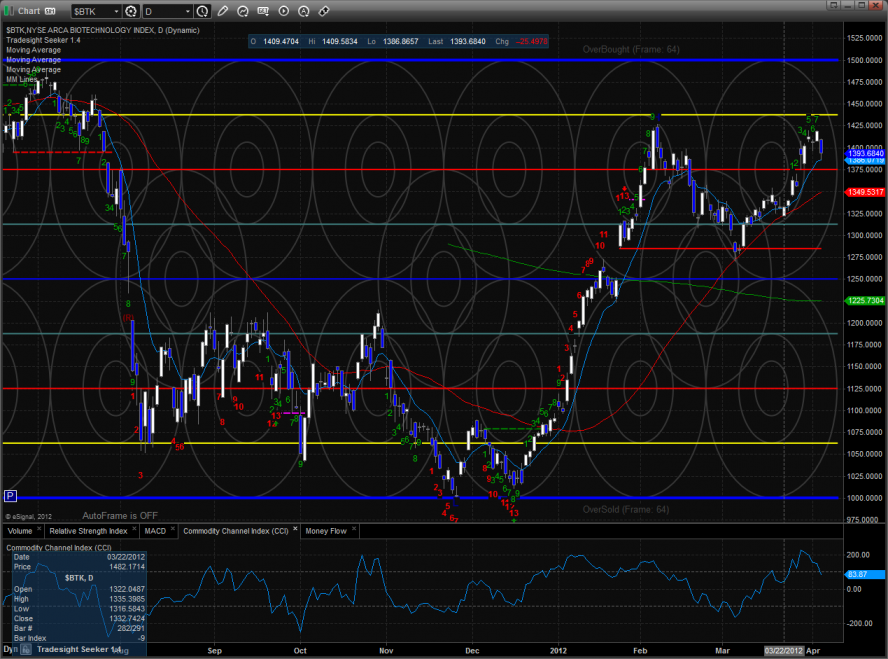
The BTK still has the potential for a nasty double top.
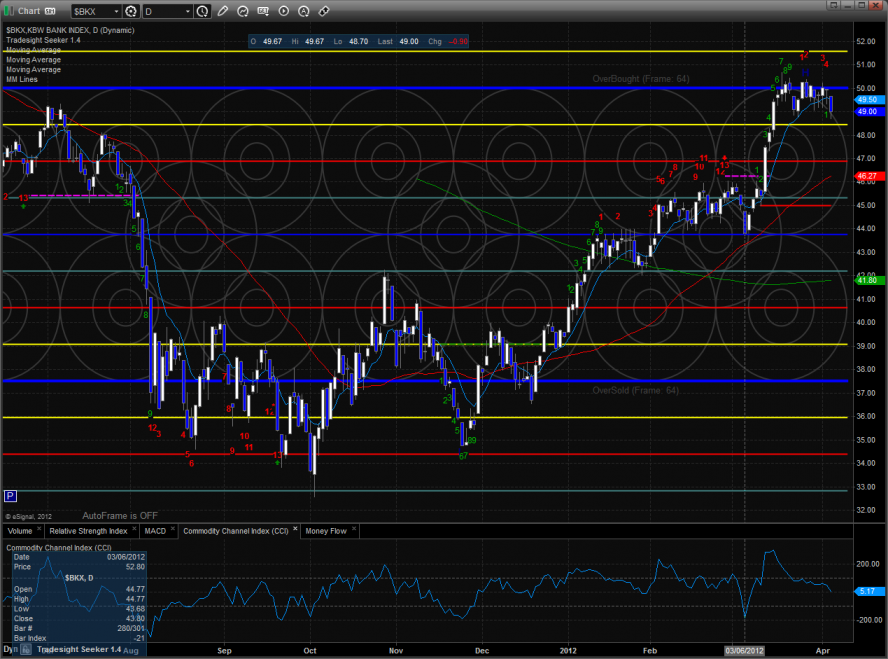
The BKX tested but did not break the recent range lows. A break under the range low would be very bearish and kick in some profit taking momentum.
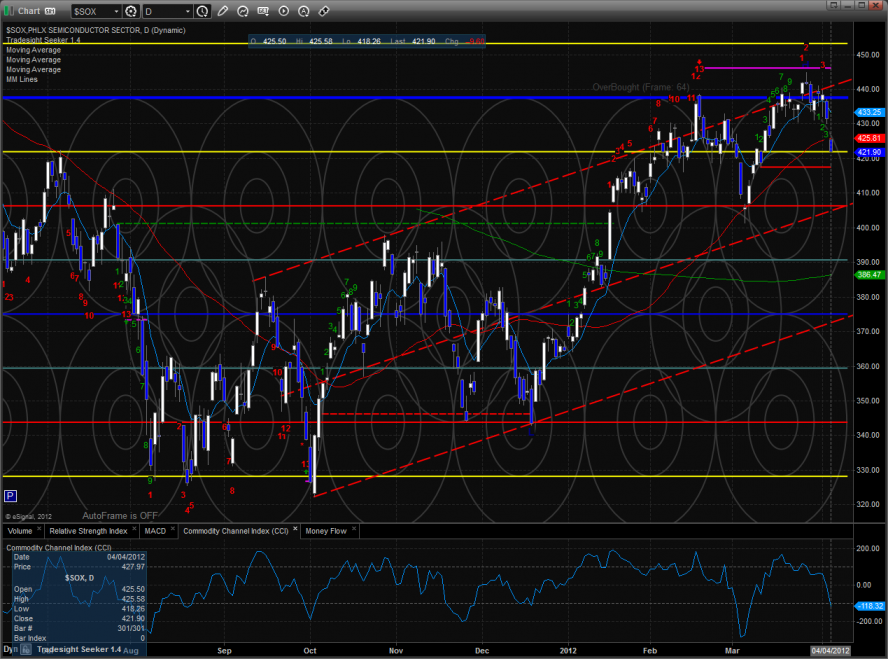
The SOX is picking up downside momentum and is now below the 10ema and 50sma. The next important target is the active static trend line.
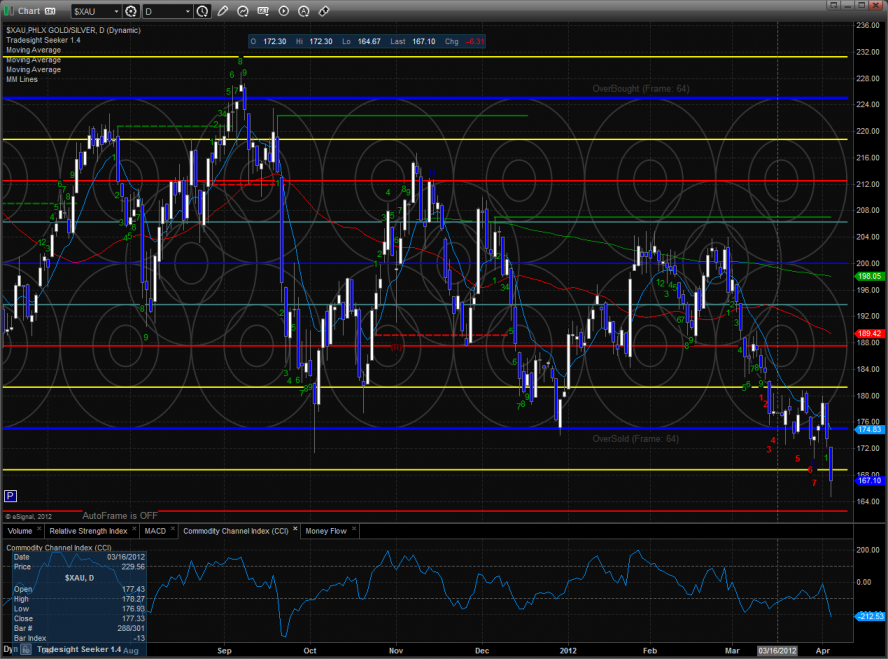
The XAU was no defensive stronghold for the bulls and made a new low on the move. The chart is in the oversold area closing below the -1/8 Murrey math level.
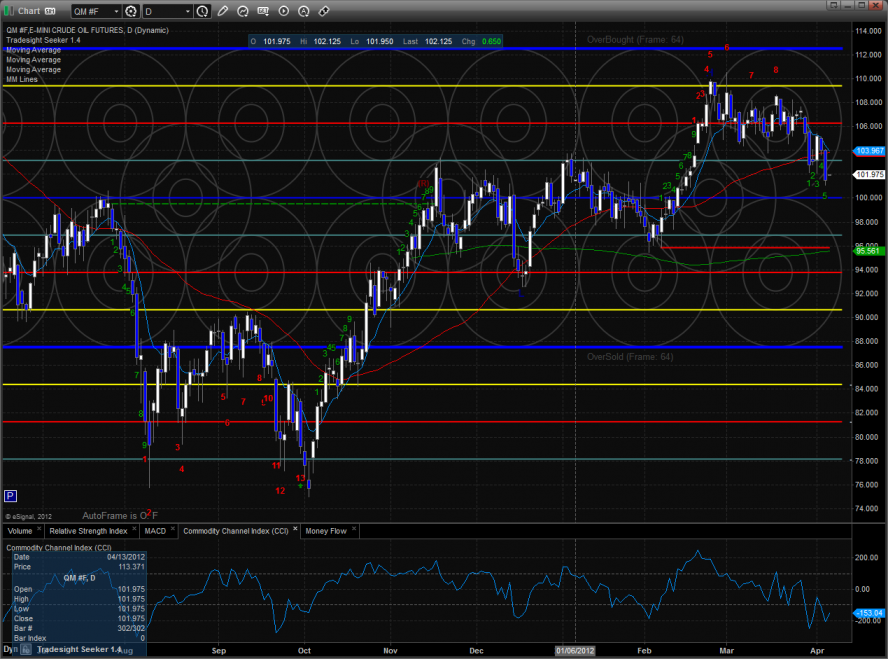
Oil:
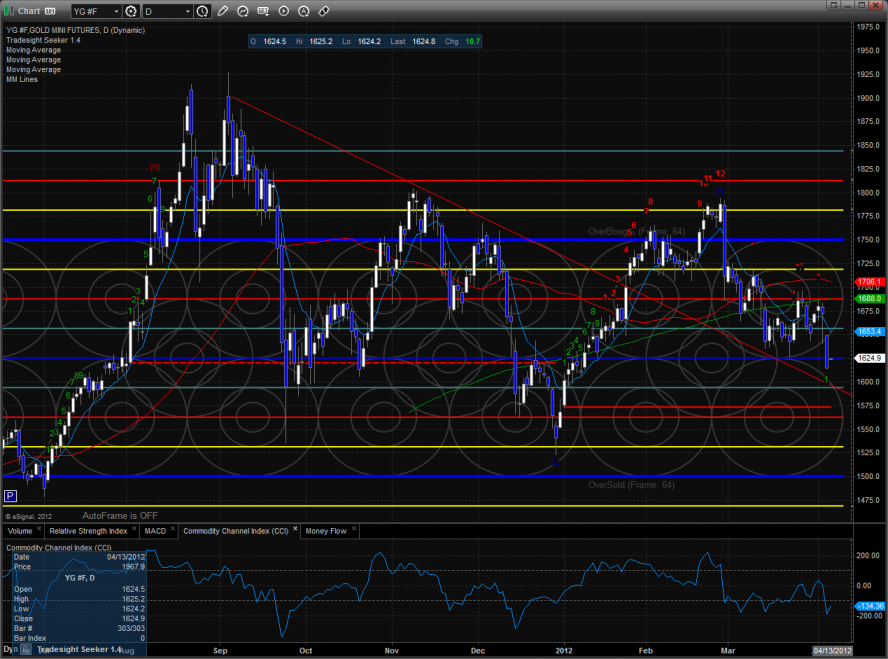
Gold:
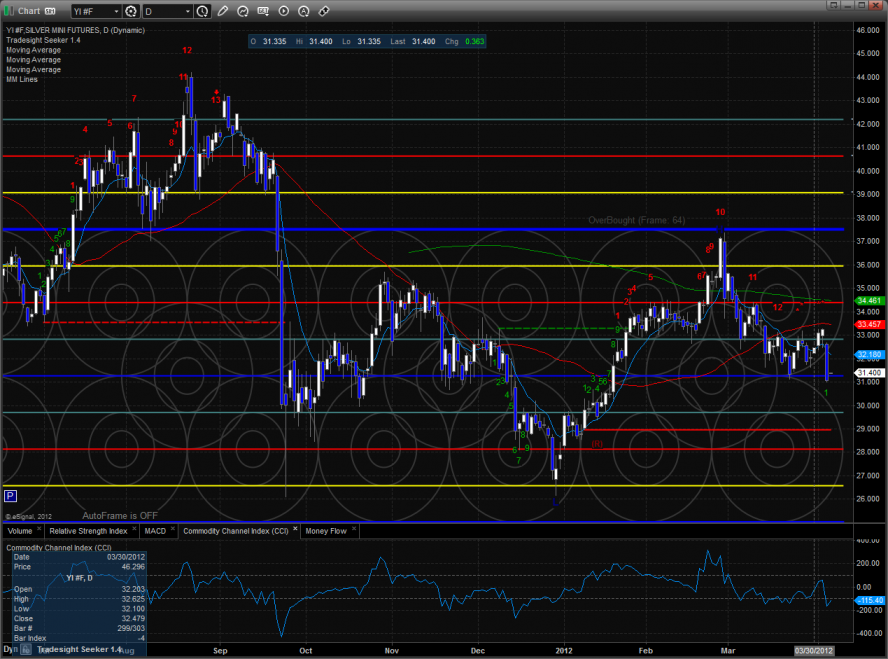
Silver:
Tradesight.com Market Preview for 4/5/12
The ES gapped down below the lower pressure threshold and could not recover. Price lost 15 on the day and settled below the 10ema.

The NQ futures broke below the recent range and decisively settled below the trend defining 10ema. A follow through day would turn the chart short-term negative.

Multi sector daily chart:

The SOX/NDX cross bearishly made a new low on the move which has negative implications for the overall NDX.

The OSX was the best performing sector on the day managing to hover above the real breakdown level below the March lows.

The BTK still has the potential for a nasty double top.

The BKX tested but did not break the recent range lows. A break under the range low would be very bearish and kick in some profit taking momentum.

The SOX is picking up downside momentum and is now below the 10ema and 50sma. The next important target is the active static trend line.

The XAU was no defensive stronghold for the bulls and made a new low on the move. The chart is in the oversold area closing below the -1/8 Murrey math level.

Oil:

Gold:

Silver:

Stock Picks Recap for 4/4/12
With each stock's recap, we will include a (with market support) or (without market support) tag, designating whether the trade triggered with or without market directional support at the time. Anything in the first five minutes will be considered WITHOUT market support because market direction cannot be determined that early. ETF calls do not require market support, and are thus either winners or losers.
From the report, RIMM and GRPN both gapped under their triggers, no plays, but they filled their gaps and then triggered with the market later, which is valid.
In the Messenger, TLT triggered short (ETF) and didn't work:

Rich's VXX triggered long (ETF) and worked enough for an easy partial:

Rich's AAPL triggered short (with market support) and worked:

GOOG triggered short (with market support) and worked:

Rich's MDVN triggered short (with market support) and worked:

In total, that's 5 trades triggering with market support, 4 of them worked, 1 did not.
Stock Picks Recap for 4/4/12
With each stock's recap, we will include a (with market support) or (without market support) tag, designating whether the trade triggered with or without market directional support at the time. Anything in the first five minutes will be considered WITHOUT market support because market direction cannot be determined that early. ETF calls do not require market support, and are thus either winners or losers.
From the report, RIMM and GRPN both gapped under their triggers, no plays, but they filled their gaps and then triggered with the market later, which is valid.
In the Messenger, TLT triggered short (ETF) and didn't work:

Rich's VXX triggered long (ETF) and worked enough for an easy partial:

Rich's AAPL triggered short (with market support) and worked:

GOOG triggered short (with market support) and worked:

Rich's MDVN triggered short (with market support) and worked:

In total, that's 5 trades triggering with market support, 4 of them worked, 1 did not.
