Tradesight.com Market Preview for 3/20/12
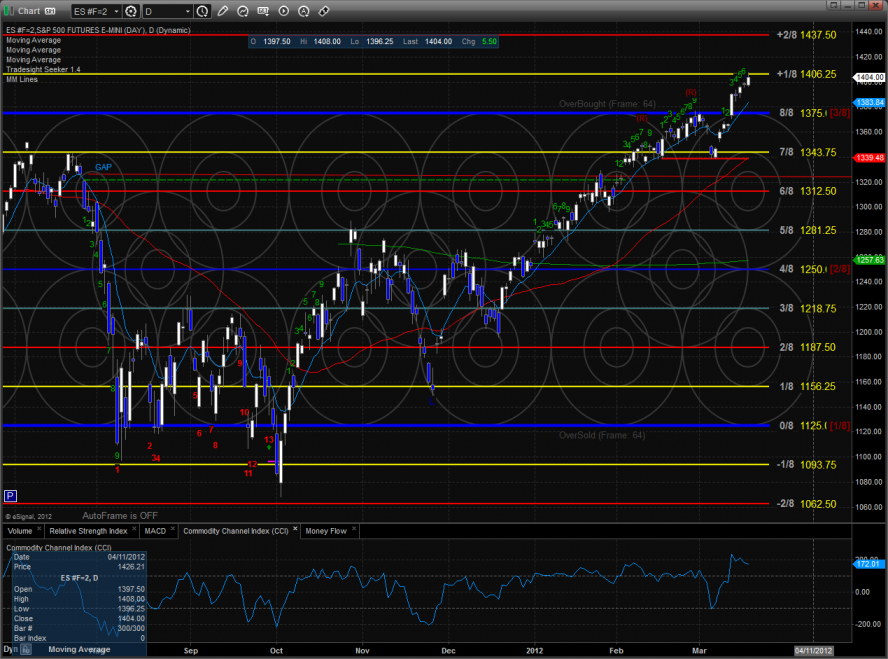
The ES broke to new high ground on the move closing deeper into the overbought Murrey math territory. Gaining 5 handles on the day the ES closed just below the 1406 level.
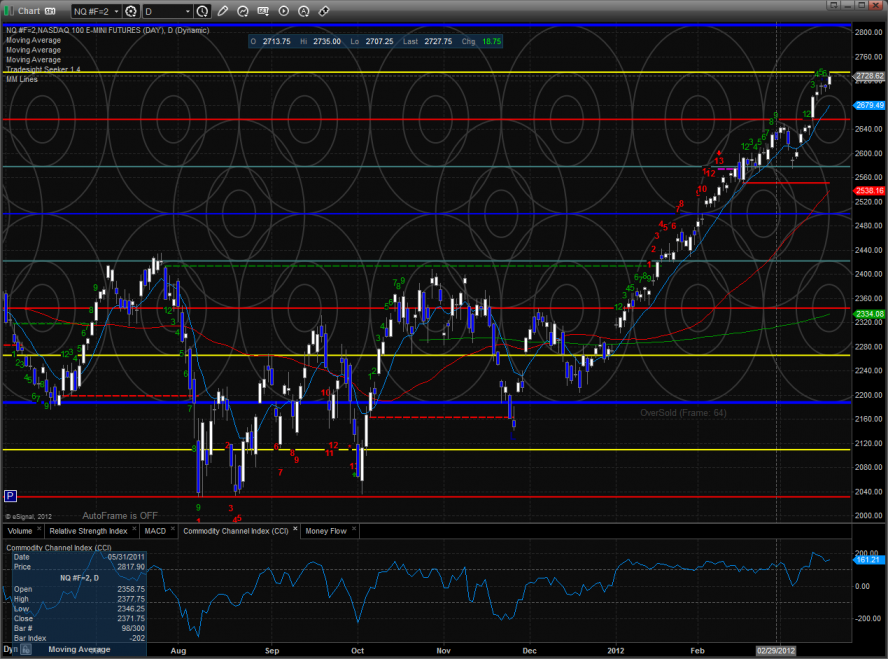
The NQ futures also made a new high adding 18 to the move. Since the Murrey math box has already frame shifted, it is not in overbought territory but very extended without any real corrective move to date.
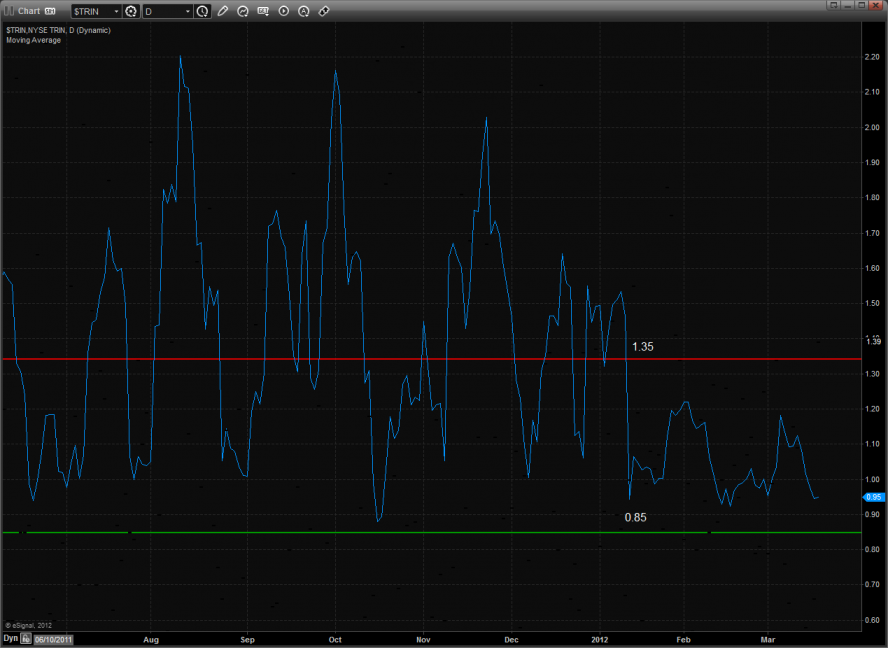
The daily Trin closed at 1.39 which was very helpful to the bulls and kept the 10-day average from recording an overbought reading below 0.85.
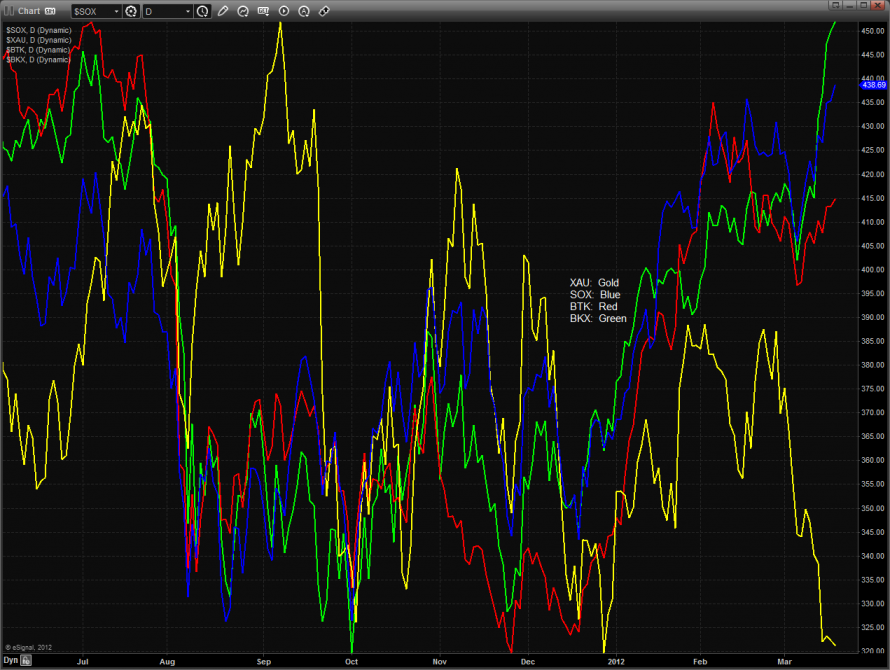
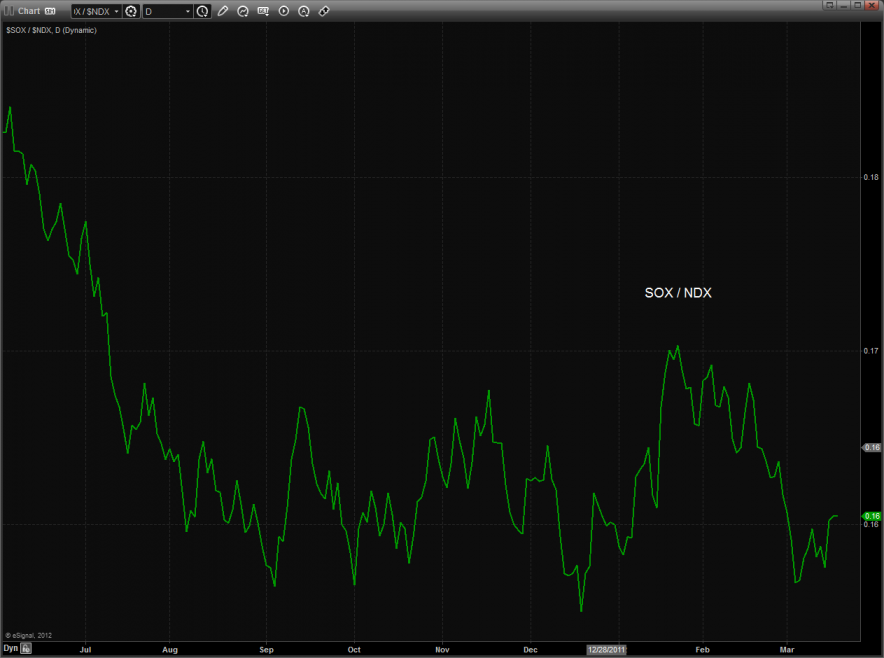
The multi sector daily chart is screaming, “Rotation”. The exit from last year’s safety play of gold stocks is clearly rotating into other more economically sensitive sectors like the BKX and SOX.
The SOX/NDX cross is bullishly bouncing off critical support:
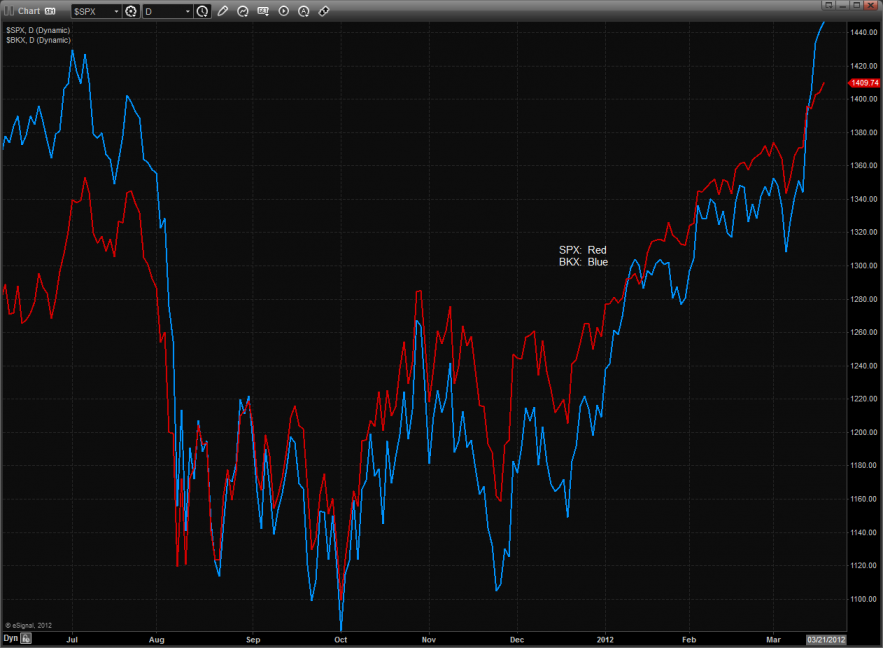
The BKX is showing good leadership over the broad market and is beginning to get a bit extended.
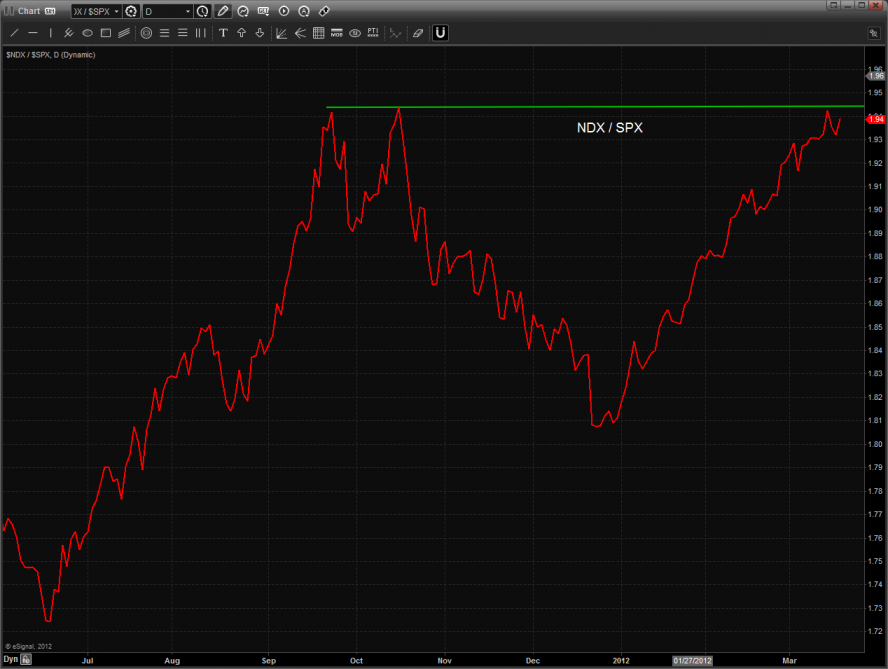
The NDX/SOX is very close to a key breakout:
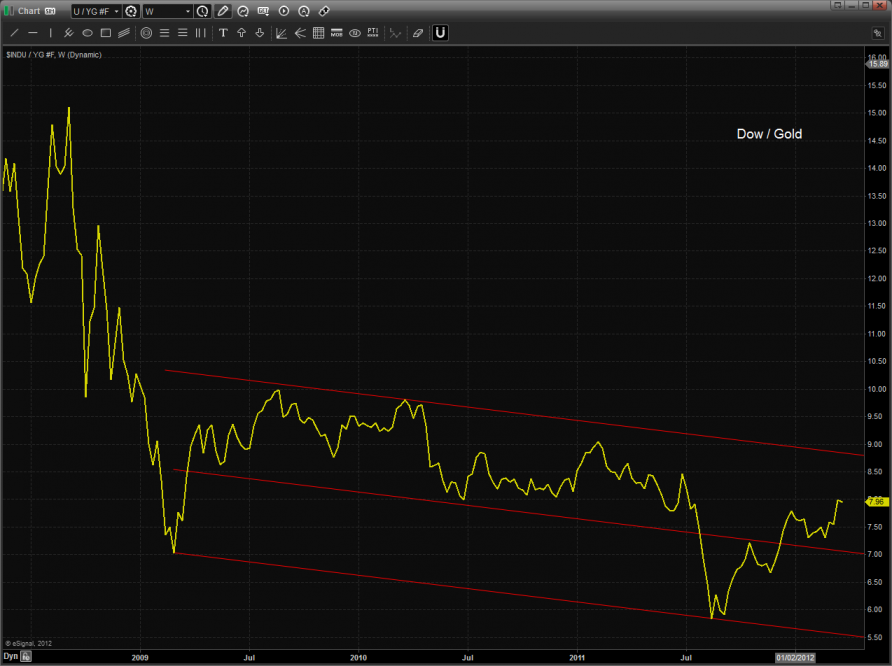
Possibly the chart to watch for long-term investors right now is the Dow/Gold ratio. The ratio in the weekly time frame is above the midpoint and a break and follow through above the upper channel would be very bullish for equities.
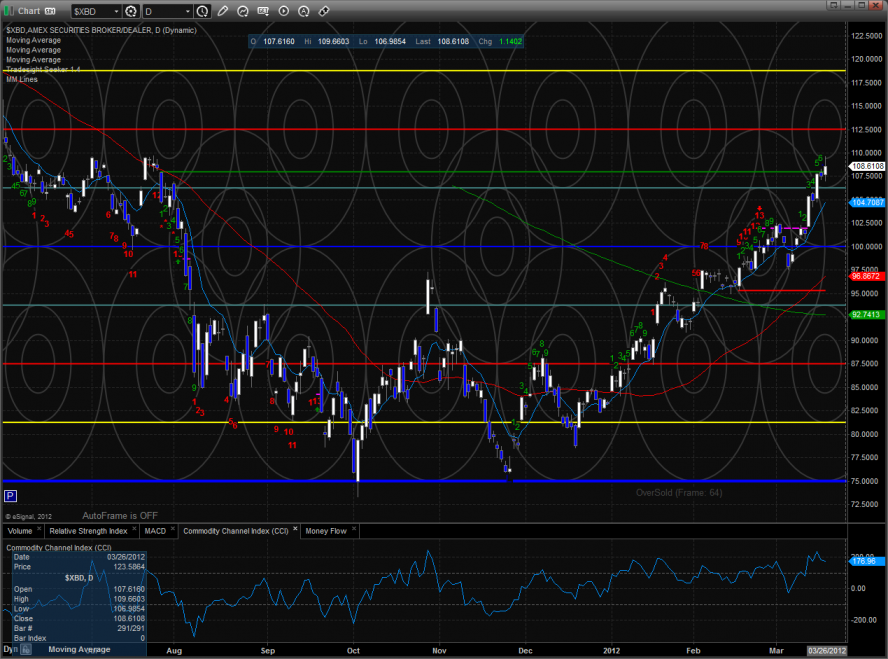
The XBD finally broke above the active static trend line Price is now 7 day up and a 9-13-9 completed Seeker run will likely be a real profit taking catalyst.
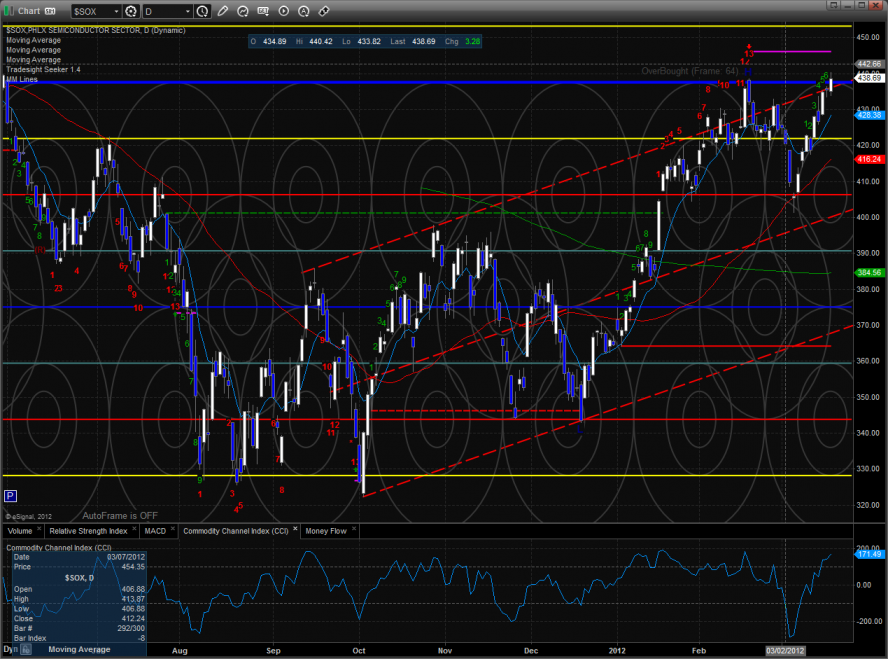
The SOX is back into the 8/8 level and still has an active Seeker sell signal.
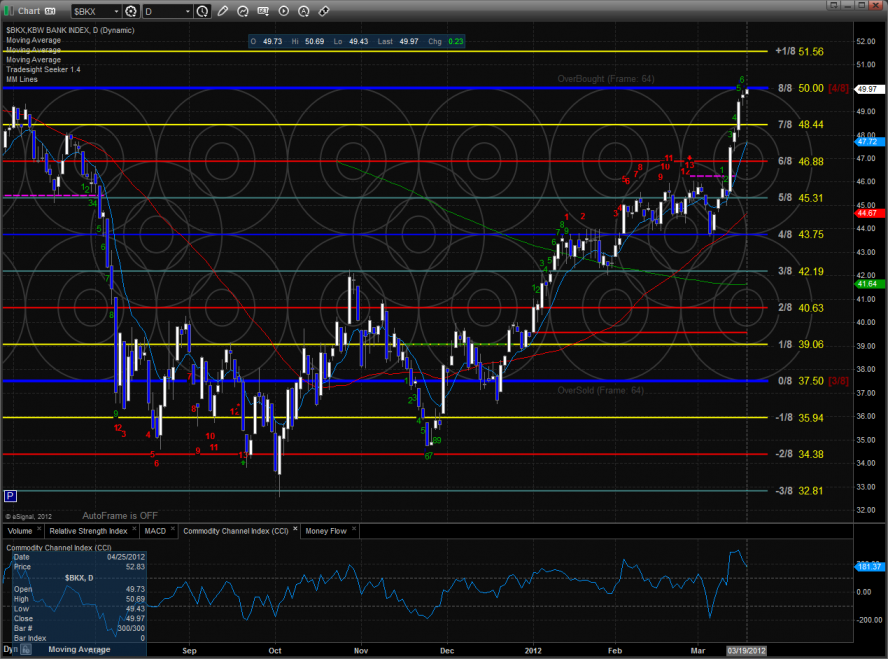
The BKX made a new high and settled right at the 8/8 level. Note the topping tail that was left on the chart.
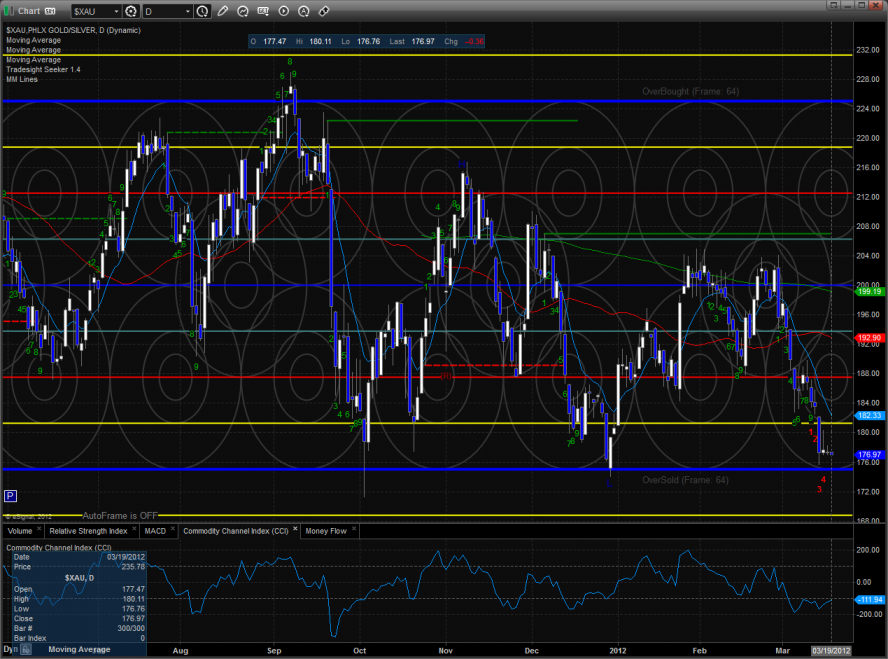
The XAU was a source of funds but is still holding above the 0/8 level.
The OSX was the last laggard on the day trading inside Friday’s candle. Note that on the chart the Seeker is hunting for an exhaustion signal with will print when price closes above the candle labeled with the red 8.
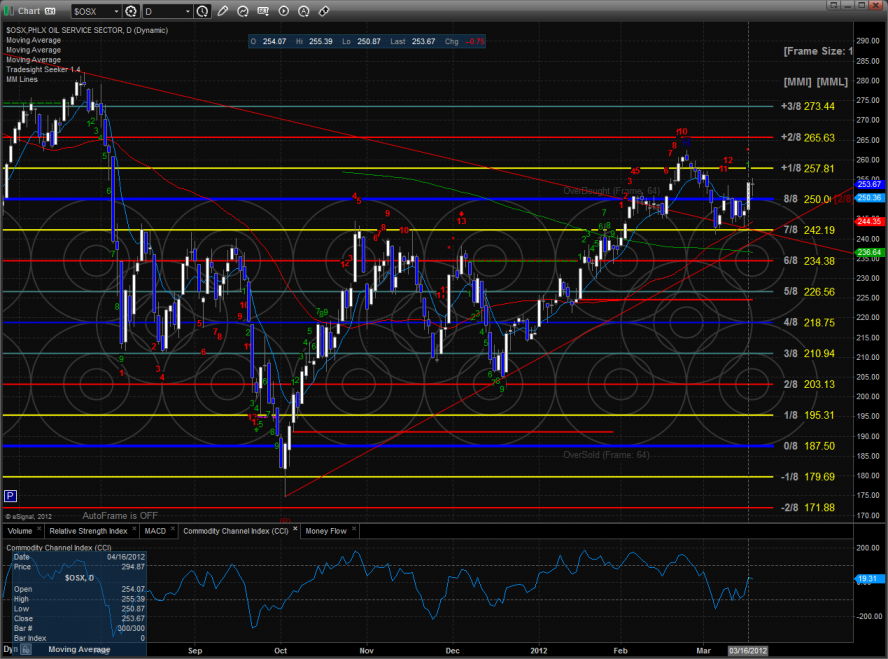
Oil:
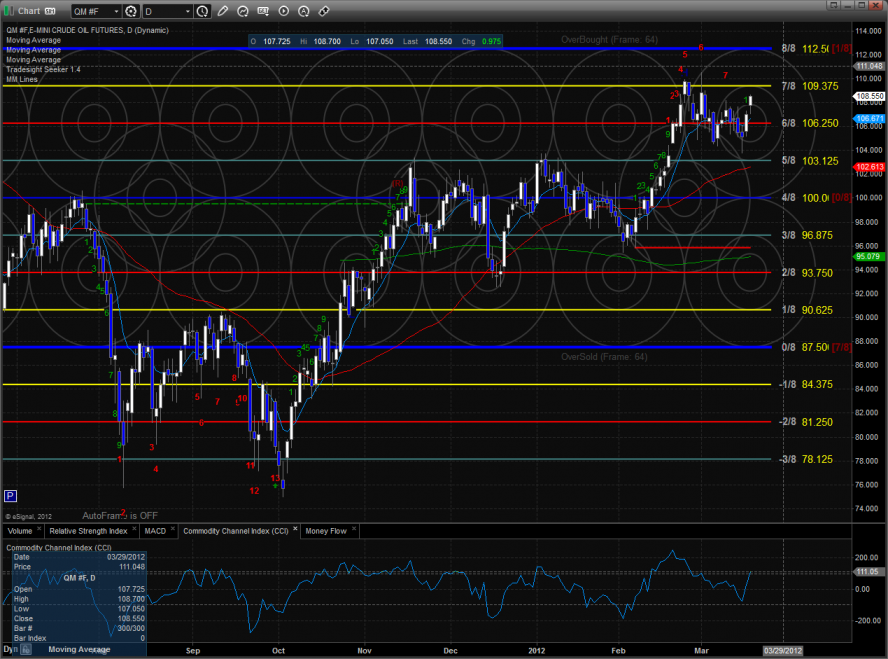
Gold:
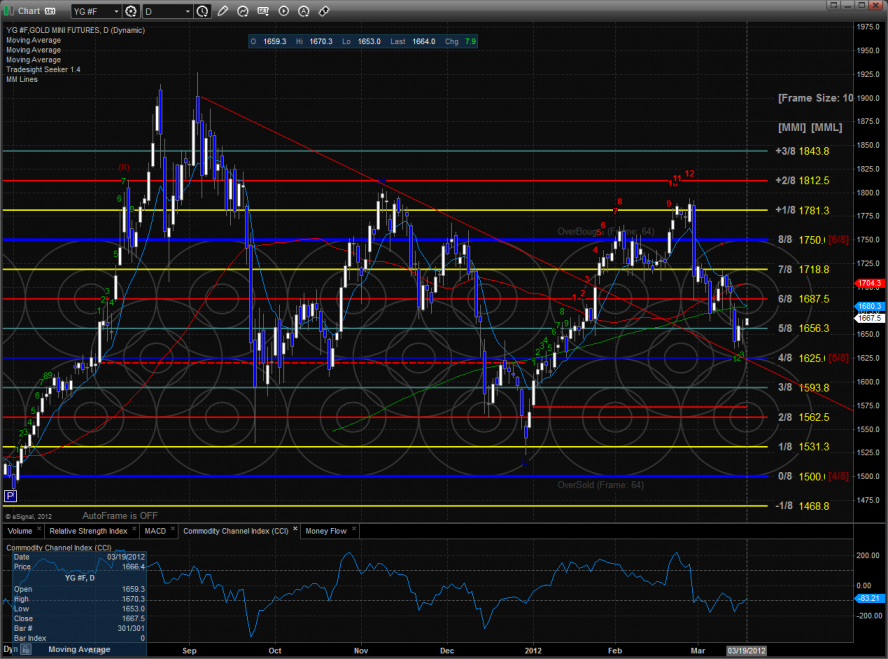
Silver:
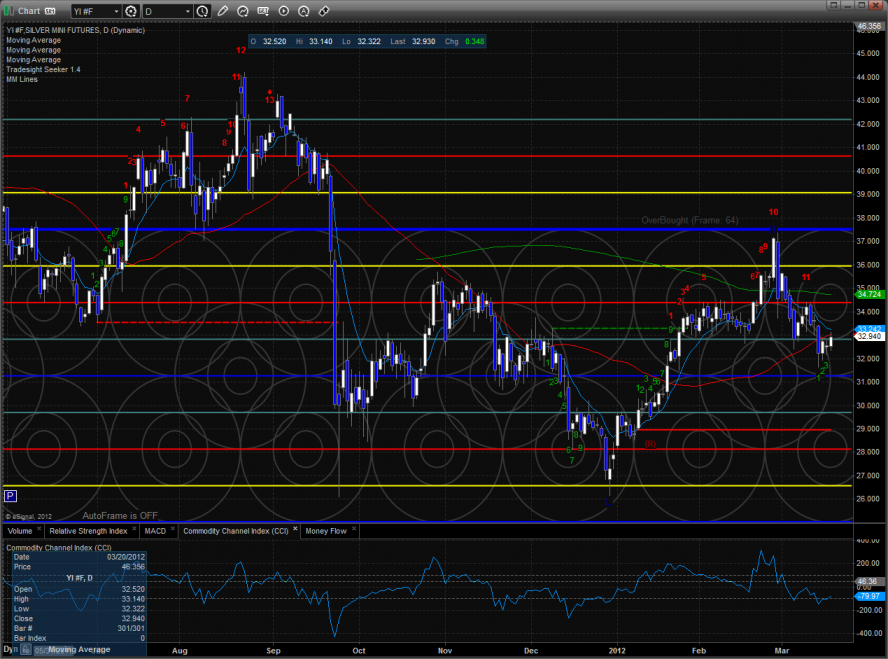
Tradesight.com Market Preview for 3/20/12
The ES broke to new high ground on the move closing deeper into the overbought Murrey math territory. Gaining 5 handles on the day the ES closed just below the 1406 level.

The NQ futures also made a new high adding 18 to the move. Since the Murrey math box has already frame shifted, it is not in overbought territory but very extended without any real corrective move to date.

The daily Trin closed at 1.39 which was very helpful to the bulls and kept the 10-day average from recording an overbought reading below 0.85.

The multi sector daily chart is screaming, “Rotation”. The exit from last year’s safety play of gold stocks is clearly rotating into other more economically sensitive sectors like the BKX and SOX.

The SOX/NDX cross is bullishly bouncing off critical support:

The BKX is showing good leadership over the broad market and is beginning to get a bit extended.

The NDX/SOX is very close to a key breakout:

Possibly the chart to watch for long-term investors right now is the Dow/Gold ratio. The ratio in the weekly time frame is above the midpoint and a break and follow through above the upper channel would be very bullish for equities.

The XBD finally broke above the active static trend line Price is now 7 day up and a 9-13-9 completed Seeker run will likely be a real profit taking catalyst.

The SOX is back into the 8/8 level and still has an active Seeker sell signal.

The BKX made a new high and settled right at the 8/8 level. Note the topping tail that was left on the chart.

The XAU was a source of funds but is still holding above the 0/8 level.

The OSX was the last laggard on the day trading inside Friday’s candle. Note that on the chart the Seeker is hunting for an exhaustion signal with will print when price closes above the candle labeled with the red 8.

Oil:

Gold:

Silver:

Tradesight Stock Call: GOOG
This week, we will be watching GOOG as a long idea above the price of $625.91. This assumes that the stock does not gap ABOVE that price in the morning. There is some nice construction in the stock and a key breakout over that level, and we are currently only 5 bars up on our 4-bar lookback methodlogy, as the chart shows in green numbers. This means that there is still several days room to the upside, and in addition, there is a gap above that needs to be filled at $639.57. Here is a look at the chart with both the breakout entry line and the gap fill target:

We will manage this trade via Twitter if it triggers. Our first goal is to sell half at $627.10, and our initial stop is a close on a 15-minute bar basis under $625.00. Have a good trading week!
Stock Picks Recap for 3/16/12
With each stock's recap, we will include a (with market support) or (without market support) tag, designating whether the trade triggered with or without market directional support at the time. Anything in the first five minutes will be considered WITHOUT market support because market direction cannot be determined that early.
From the report, PWRD gapped over, no play.
In the Messenger, Rich's AAPL triggered short (with market support) and didn't work:

NFLX triggered short (with market support) and didn't work:

Wasn't worth making any additional calls.
In total, that's 2 trades triggering with market support, neither of them worked.
Forex Calls Recap for 3/16/12
A loser and a nice winner to close out the week on a positive note. Amazing how that happens when you actually get range, most of which came after the CPI data, no surprise.
As usual on the Sunday report, we will take a look at the action from Thursday night/Friday, then look at the daily charts heading into the new week with our Seeker and Comber counts separately, and then glance at the US Dollar Index, which really has nothing new to say.
Calls resume Sunday.
Here's the US Dollar Index intraday with our market directional levels:

EURUSD:
Triggered short at A and stopped. Triggered long at B, NEVER WENT 20 PIPS AGAINST THE TRIGGER LEVEL, hit first target at C, and closed final piece for end of week at D:

The rest of the weekend analysis is available for subscribers only.
Forex Calls Recap for 3/16/12
A loser and a nice winner to close out the week on a positive note. Amazing how that happens when you actually get range, most of which came after the CPI data, no surprise.
As usual on the Sunday report, we will take a look at the action from Thursday night/Friday, then look at the daily charts heading into the new week with our Seeker and Comber counts separately, and then glance at the US Dollar Index, which really has nothing new to say.
Calls resume Sunday.
Here's the US Dollar Index intraday with our market directional levels:

EURUSD:
Triggered short at A and stopped. Triggered long at B, NEVER WENT 20 PIPS AGAINST THE TRIGGER LEVEL, hit first target at C, and closed final piece for end of week at D:

The rest of the weekend analysis is available for subscribers only.
Stock Picks Recap for 3/15/12
With each stock's recap, we will include a (with market support) or (without market support) tag, designating whether the trade triggered with or without market directional support at the time. Anything in the first five minutes will be considered WITHOUT market support because market direction cannot be determined that early.
From the report, MPEL triggered long (with market support) and didn't work:

ADSK triggered long (with market support) and worked (ignoring the bad price spike on the opening bar):

CHKP triggered long (with market support) and worked great:

MXIM triggered long (with market support) and didn't work:

RGLD triggered short (with market support) and didn't work:

In the Messenger, Rich's first AAPL call triggered short (without market support) and worked:

His second AAPL call later in the day triggered short (without market support) and worked:

Several other calls did not trigger.
In total, that's 5 trades triggering with market support, 2 of them worked, 3 did not. Under 50% first the first time in a while on a light volume day.
Stock Picks Recap for 3/15/12
With each stock's recap, we will include a (with market support) or (without market support) tag, designating whether the trade triggered with or without market directional support at the time. Anything in the first five minutes will be considered WITHOUT market support because market direction cannot be determined that early.
From the report, MPEL triggered long (with market support) and didn't work:

ADSK triggered long (with market support) and worked (ignoring the bad price spike on the opening bar):

CHKP triggered long (with market support) and worked great:

MXIM triggered long (with market support) and didn't work:

RGLD triggered short (with market support) and didn't work:

In the Messenger, Rich's first AAPL call triggered short (without market support) and worked:

His second AAPL call later in the day triggered short (without market support) and worked:

Several other calls did not trigger.
In total, that's 5 trades triggering with market support, 2 of them worked, 3 did not. Under 50% first the first time in a while on a light volume day.
Tradesight Rolls Out Latest Futures Levels Service
Effective this evening, Tradesight is updating the Futures Levels service, as previously announced. The new service will cover the following contracts:
ES, NQ, YM, ER/TF, QM, YG.
The ZN contract has been dropped from the service for now.
The Levels have been expanded to include the following information each day (new items in bold):
Previous Day's Open, High, Low, Close, UBreak, LBreak, VAH, VAL, R4, R3, R2, R1, Pivot, S1, S2, S3, S4, UPT, LPT, and 4 Starred Levels.
The printable version of the page, which subscribers can reach by logging into the website and going to Subscriptions...Futures Levels, will be available later this evening showing tomorrow's data.
The latest versions of the e-Signal tools are available here. If you have a prior version installed, the best course of action is the following:
1) Close e-Signal and data manager
2) In Control Panel, uninstall Tradesight Suite for e-Signal
3) Download the new version for either e-Signal 10.6 or 11.x here and install it
4) For any chart that had the old version, you will have to remove the Formula, then right-click on the chart and hit Formulas, Tradesight, Futures Level 1.4.
This tool has more options and is editable in more ways than the last version, including backtesting of data. You can see the options by right-clicking on the chart and hitting Edit Studies.
The new Levels service is the basis for the Futures course that will be taught this weekend.
Forex Calls Recap for 3/15/12
Took a while to play out, but we have a nice winner going from the session in the GBPUSD finally after a slow week. See that section below for the recap.
Here's the US Dollar Index intraday with our market directional lines:

New calls and Chat tonight, but CPI in the morning, so half size.
GBPUSD:
Triggered long at A, hit first target at B, stop under VAH and holding:

