Forex Calls Recap for 3/6/12
Nice winner in the GBPUSD (see below) and the trade is still going, holding into the next session.
Here's the US Dollar Index intraday with market directional lines:

New calls and Chat tonight.
GBPUSD:
Triggered short at A, hit first target at B, lowered stop twice and currently have a stop over S2:

Tradesight.com Market Preview for 3/7/12
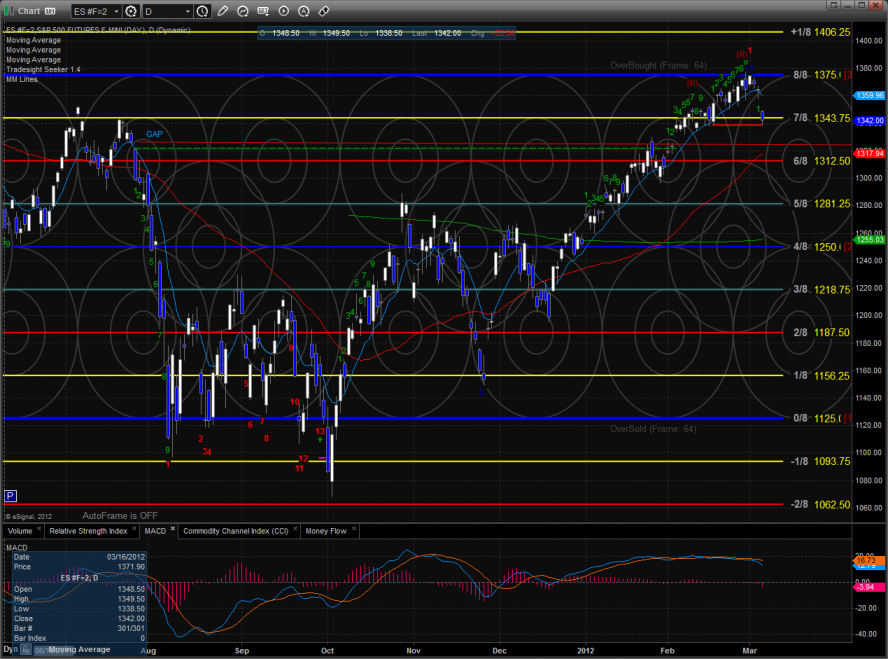
The ES gapped down significantly and proceeded to do nothing much. Price did settle below the open so this qualifies as a distribution day. Note how the chart used the static trend line for support. The next level of support is going to be the rising 50sma.
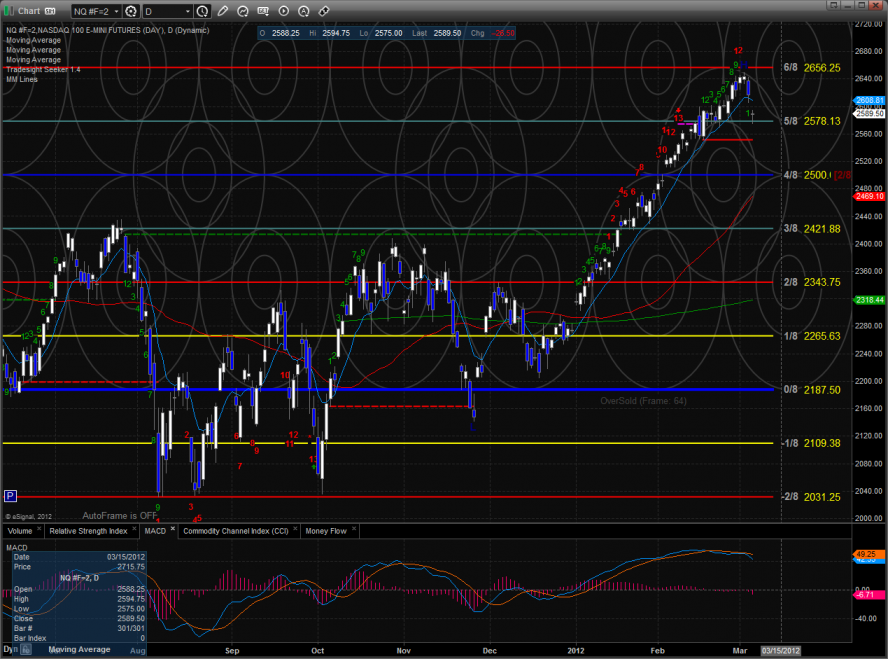
The NQ futures were lower on the day by 26 which made them relatively strong vs. the ES futures on the day. The active static trend line has not come into play and will be key support when it comes into range. The MACD could just be beginning to rollover which would put downside momentum into the pattern. Price closed below the short-term 10ema.
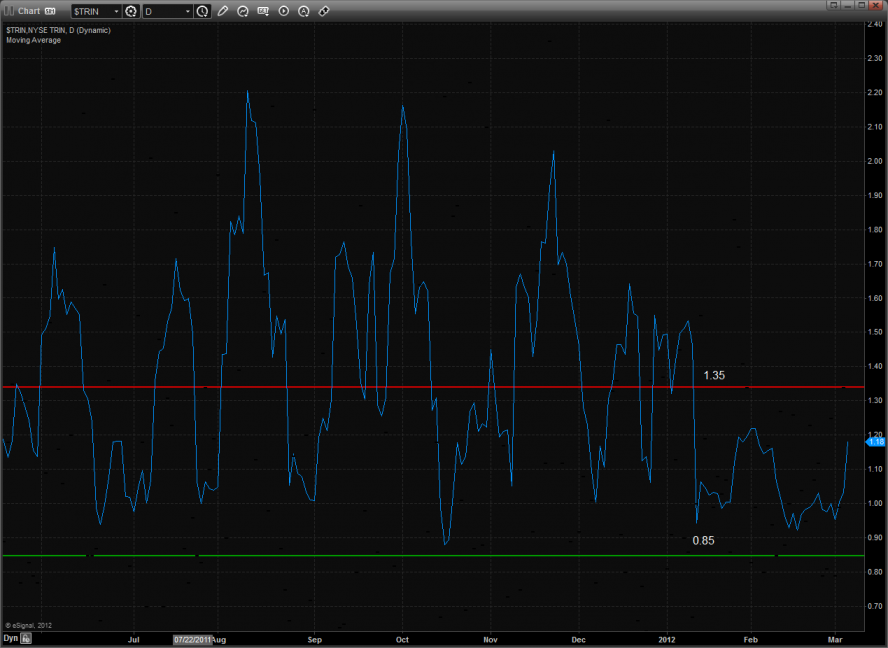
The 10-day Trin is climbing quickly.
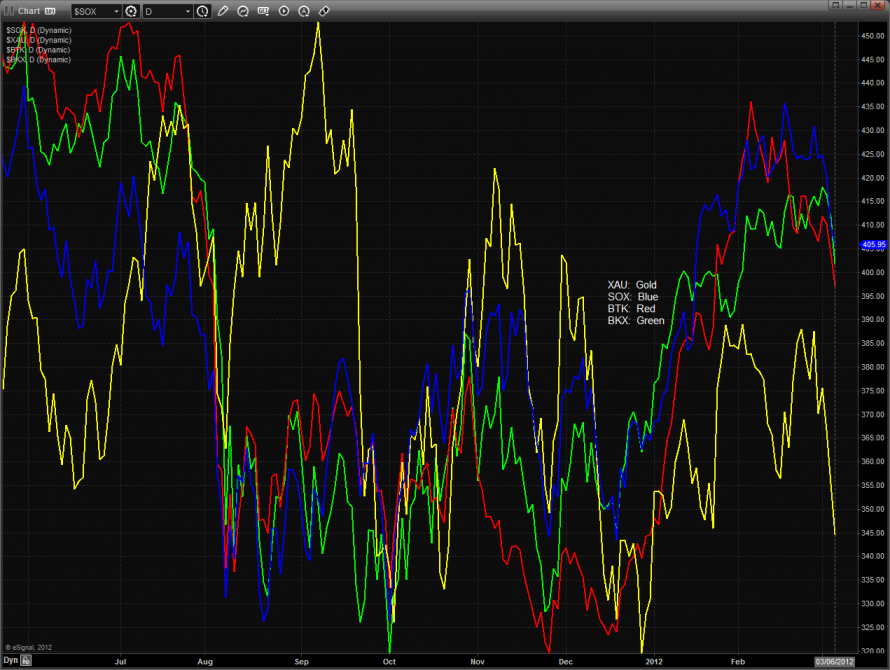
The multi sector daily chart shows how the XAU members continue to get beat with the ugly stick.
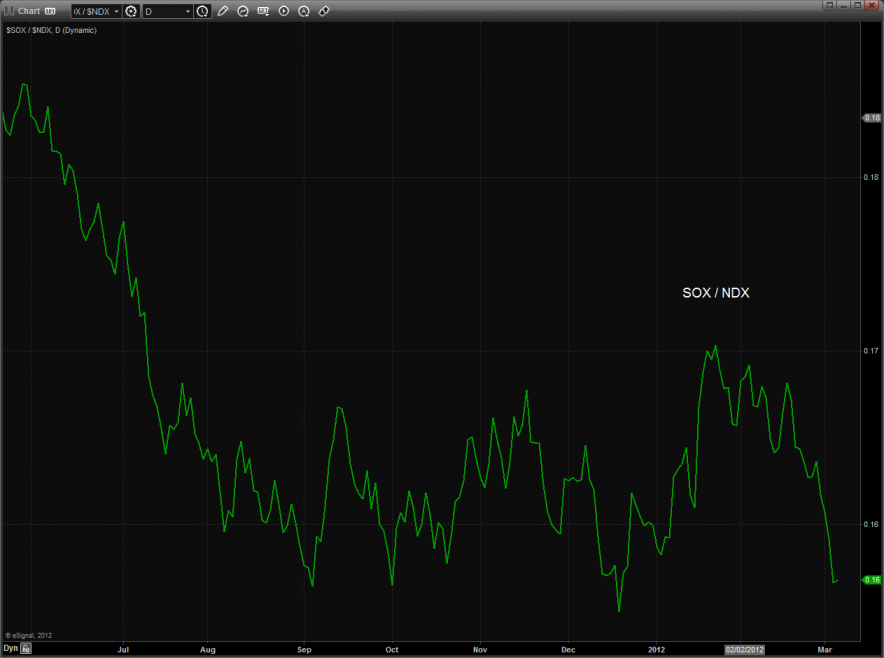
The SOX did not break to a new low vs. the NDX which is one of the small bright points on the day.
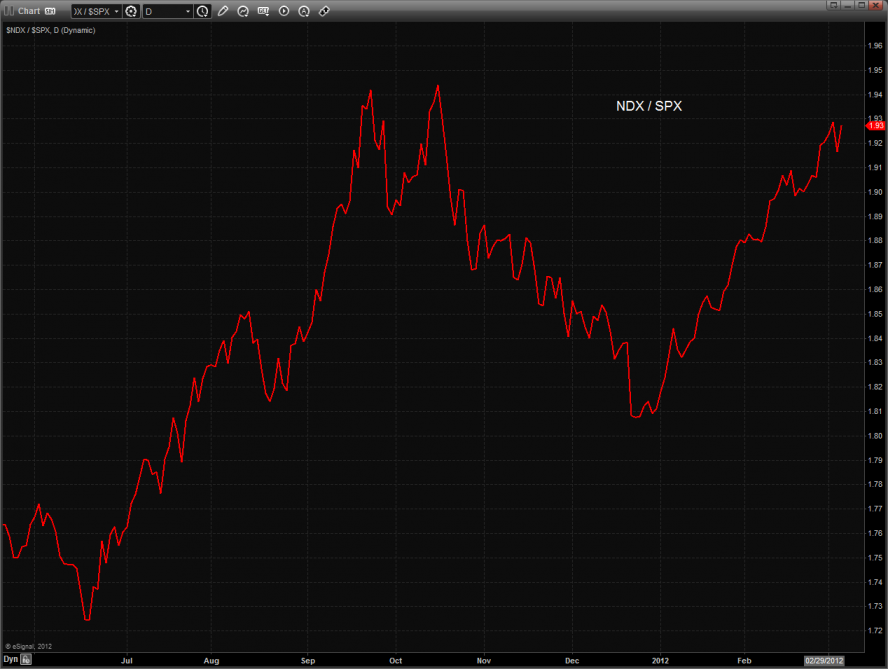
The relative strength in the NDX today can be clearly seen in the NDX/SPX cross. A real break and rollover would be confirmation that the bears have taken control of the market. This often takes time and we need to monitor this carefully. This is one of the intermarket keys that would put traders on guard that the change in trend will be a lasting one.
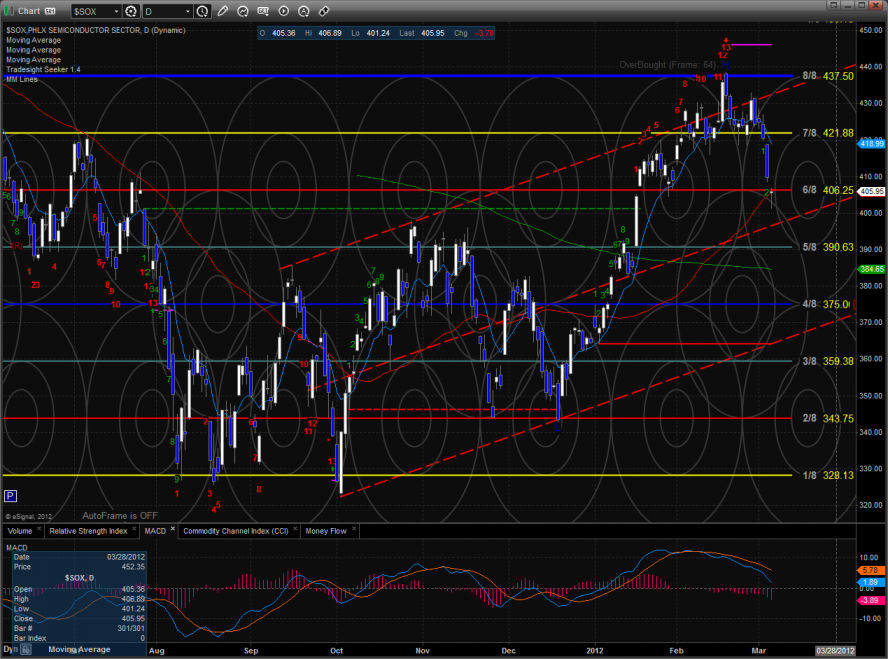
The SOX was the top gun on the day which means that it was the best of the bad. Price is currently using the 50dma for support. The measured move target off the H&S pattern projects down to about 395 which has not traded yet.
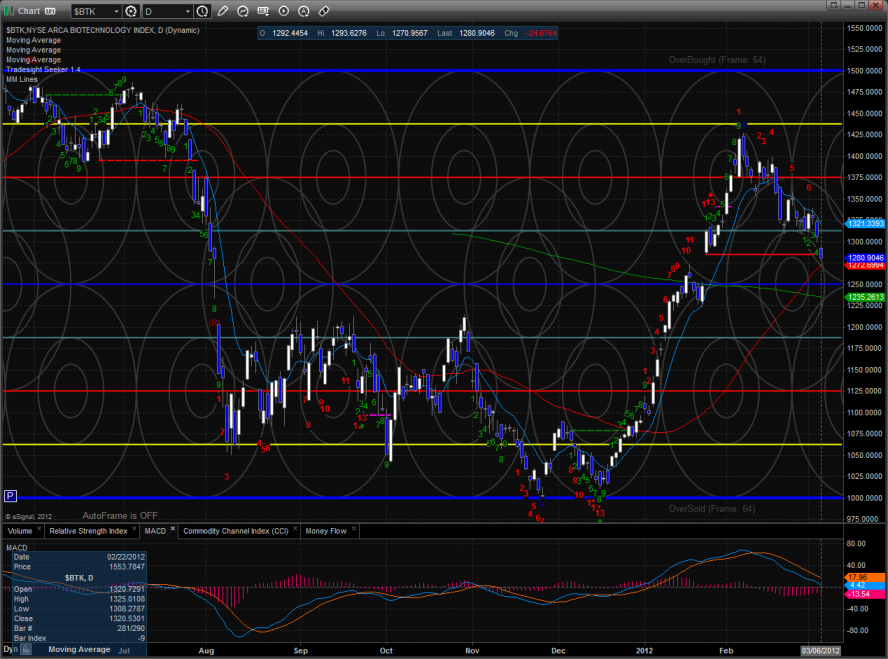
The BTK has come into first support at the 50dma. The Seeker count is only 5 days down so it is still very possible for the 200dma to come into play.
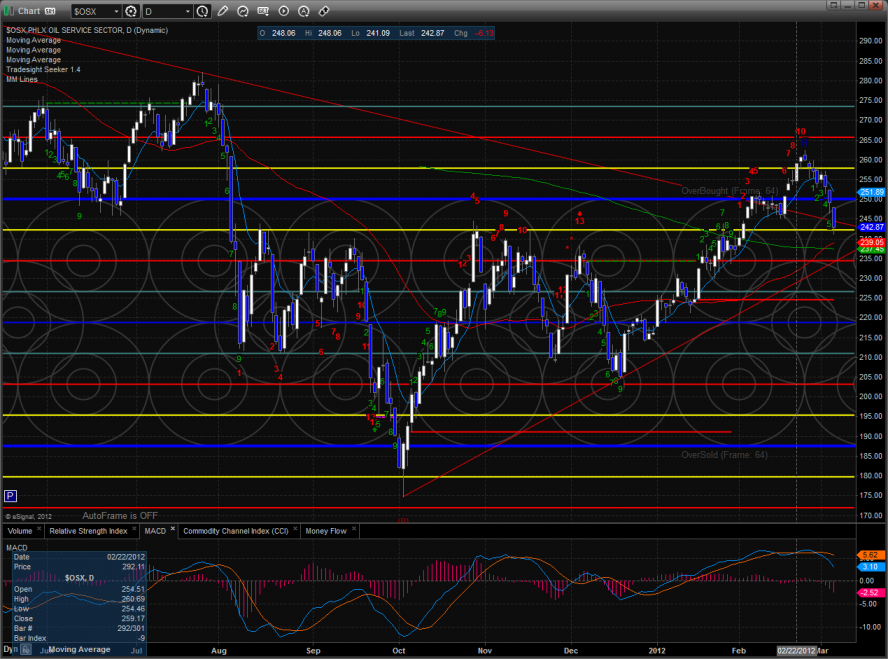
The OSX has key support just a little below Tuesday’s low where the 50 and 200dmas converge. If price breaks below the lower boundary of the old pennant and the MACD breaks the zero line, look out below.
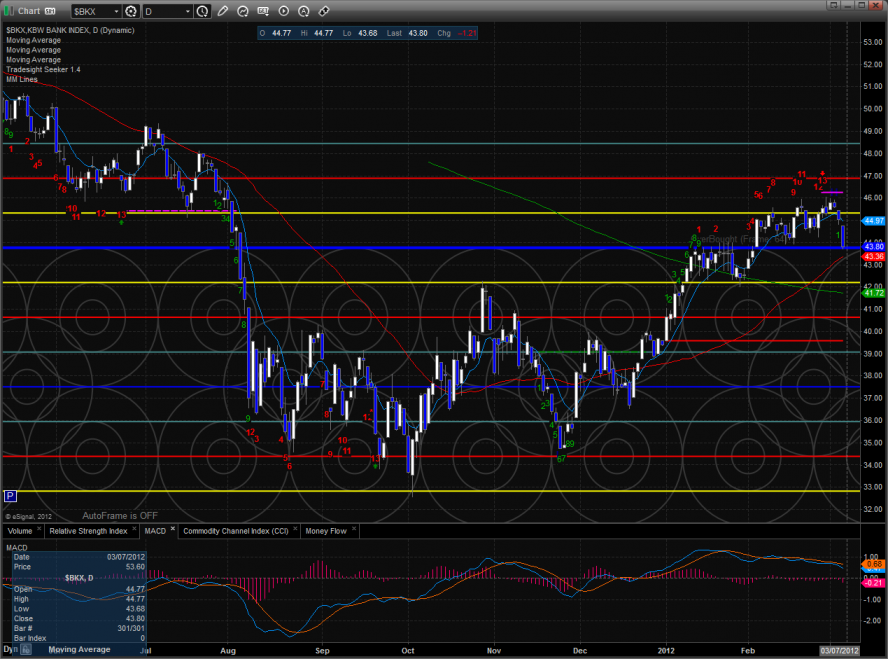
The BKX was weaker than the broad market. Keep in mind that he 13 exhaustion signal is still active and hasn’t really influenced price yet. The typical expectation of a counter move is a 9 bar move in the direction of the signal.
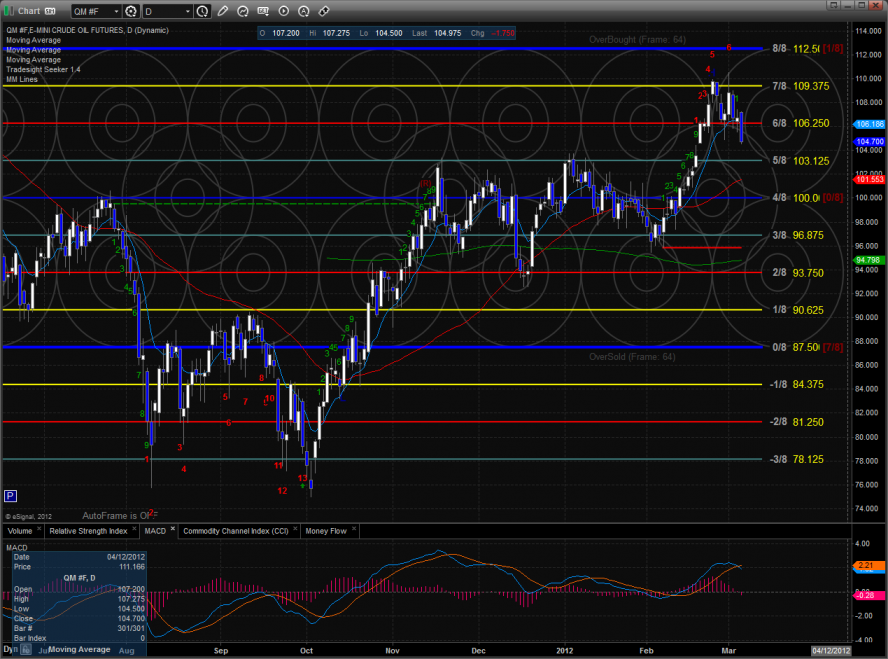
Oil:
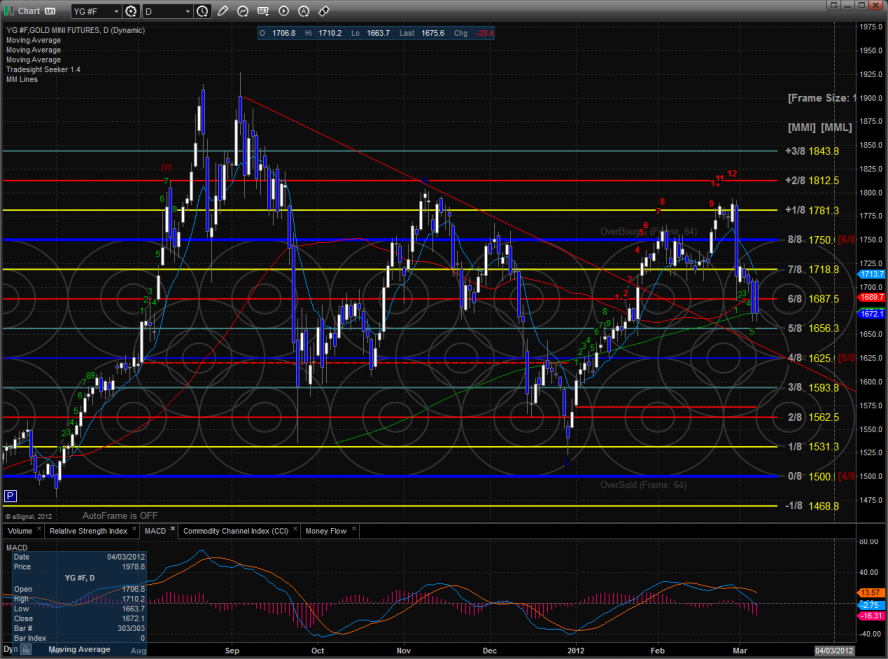
Gold:
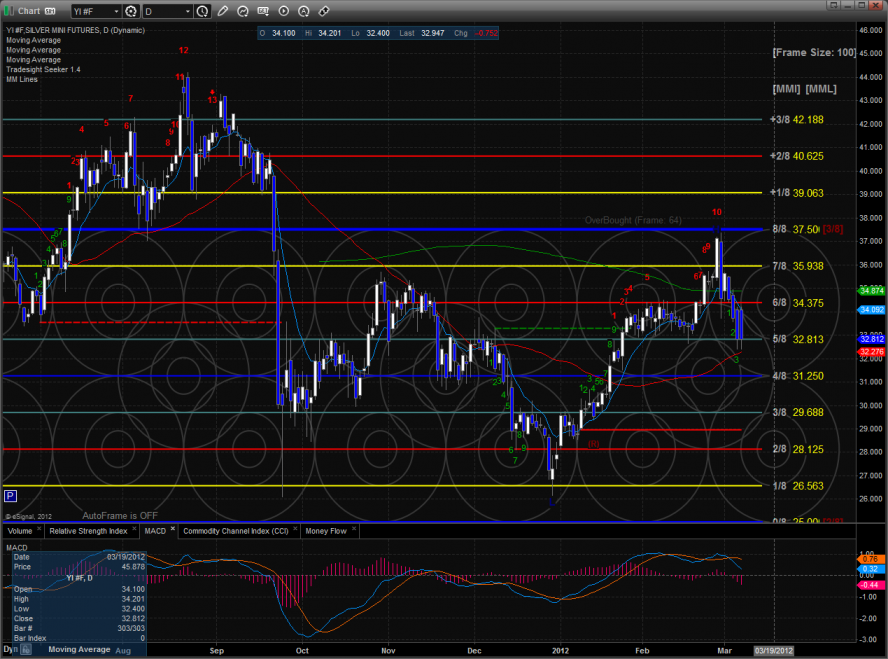
Silver:
Tradesight.com Market Preview for 3/7/12
The ES gapped down significantly and proceeded to do nothing much. Price did settle below the open so this qualifies as a distribution day. Note how the chart used the static trend line for support. The next level of support is going to be the rising 50sma.

The NQ futures were lower on the day by 26 which made them relatively strong vs. the ES futures on the day. The active static trend line has not come into play and will be key support when it comes into range. The MACD could just be beginning to rollover which would put downside momentum into the pattern. Price closed below the short-term 10ema.

The 10-day Trin is climbing quickly.

The multi sector daily chart shows how the XAU members continue to get beat with the ugly stick.

The SOX did not break to a new low vs. the NDX which is one of the small bright points on the day.

The relative strength in the NDX today can be clearly seen in the NDX/SPX cross. A real break and rollover would be confirmation that the bears have taken control of the market. This often takes time and we need to monitor this carefully. This is one of the intermarket keys that would put traders on guard that the change in trend will be a lasting one.

The SOX was the top gun on the day which means that it was the best of the bad. Price is currently using the 50dma for support. The measured move target off the H&S pattern projects down to about 395 which has not traded yet.

The BTK has come into first support at the 50dma. The Seeker count is only 5 days down so it is still very possible for the 200dma to come into play.

The OSX has key support just a little below Tuesday’s low where the 50 and 200dmas converge. If price breaks below the lower boundary of the old pennant and the MACD breaks the zero line, look out below.

The BKX was weaker than the broad market. Keep in mind that he 13 exhaustion signal is still active and hasn’t really influenced price yet. The typical expectation of a counter move is a 9 bar move in the direction of the signal.

Oil:

Gold:

Silver:

Tradesight.com Market Preview for 3/6/12
The ES continues to have trouble with the 8/8 level and Monday gave back 4 handles. Price settled right on the important 10ema. A close below this level would be the first sign of a short-term change in trend.

The NQ futures we also lower on the day and settled right around the 10ema. Keep in mind that the Seeker 9-13-9 pattern has not yet released any of its energy to the downside. The first target after a CIT will be the active static trend line around 2550.
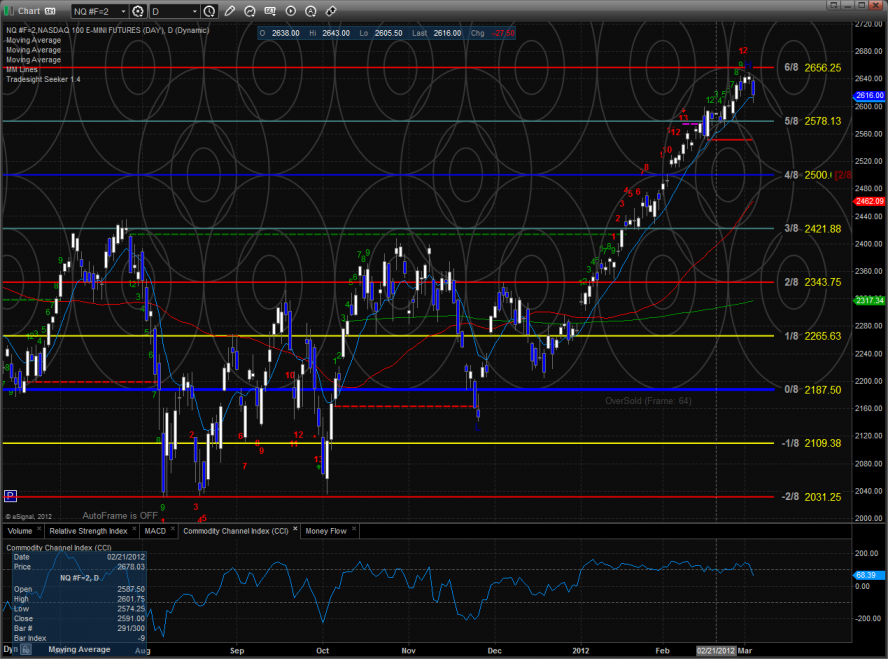
Multi sector daily chart:

The 10-day Trin is still neutral:

The SOX/NDX cross pair took a huge hit. A break to a new low would be bearish and likely break the broader NDX100.

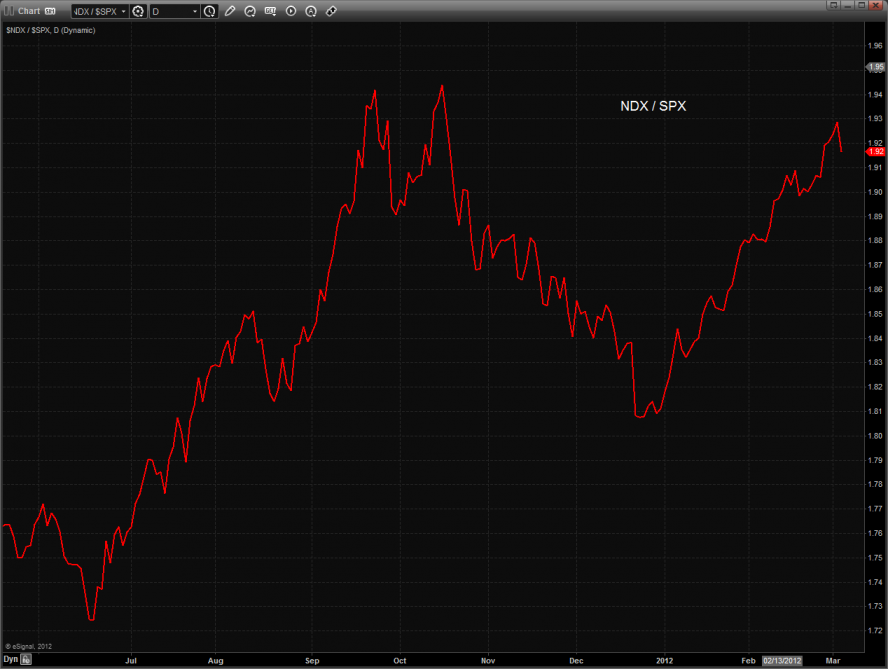
The NDX/SPX cross is also flashing a warning sign. The chart has yet to produce a new high where the relative strength of the NDX could really assert itself and now it could possibly be rolling over. A break under 1.90 will be the deal breaker.
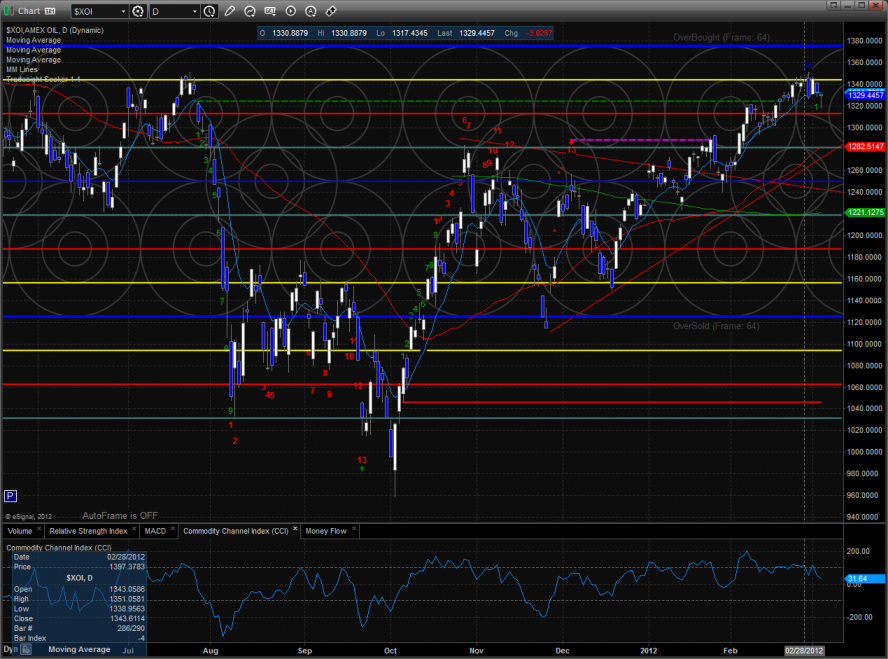
The XOI was the best performing sector. It was lower on the day by a fraction but bullishly closed near the high.
The BKX is still range bound but there is still an active Seeker sell signal that has yet to influence price.

The OSX is backing off and should find better support after it gets back into the pattern and near the moving averages which are all in the same price neighborhood.

The BTK continues to roll over and is getting closer to first support at the static trend line (red). Keep in mind that with the gap on the chart the static trend line level is very important and will be an important break level if breeched.

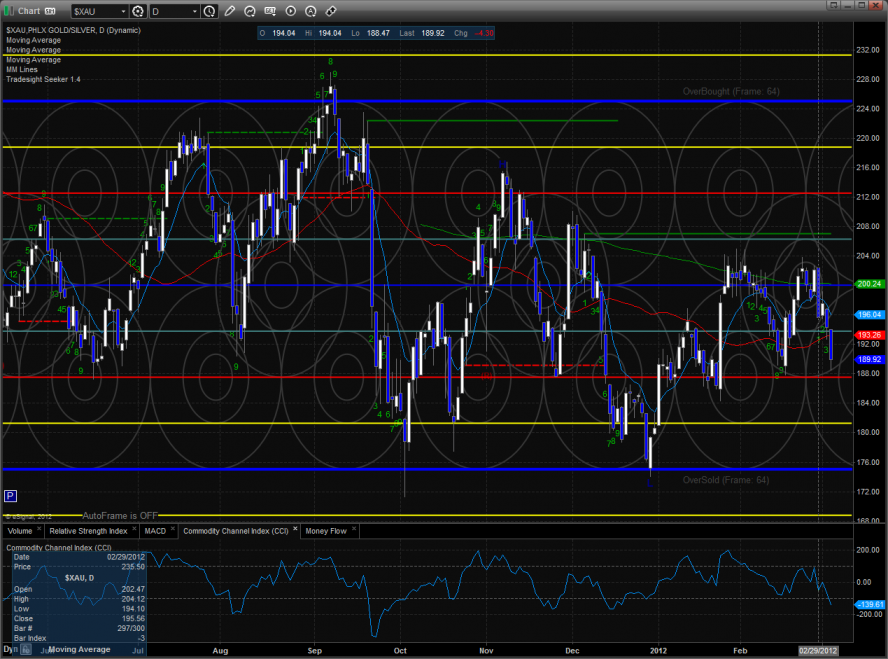
The XAU offered little safety and was much weaker than the major averages on the day. The chart continues to print lower high after lower high.
The SOX was the last laggard on the day and broke through the neck line of the head and shoulders pattern. This projects price roughly down to the midpoint of the trend channel for the typical H & S measured move.

Oil:

Gold:

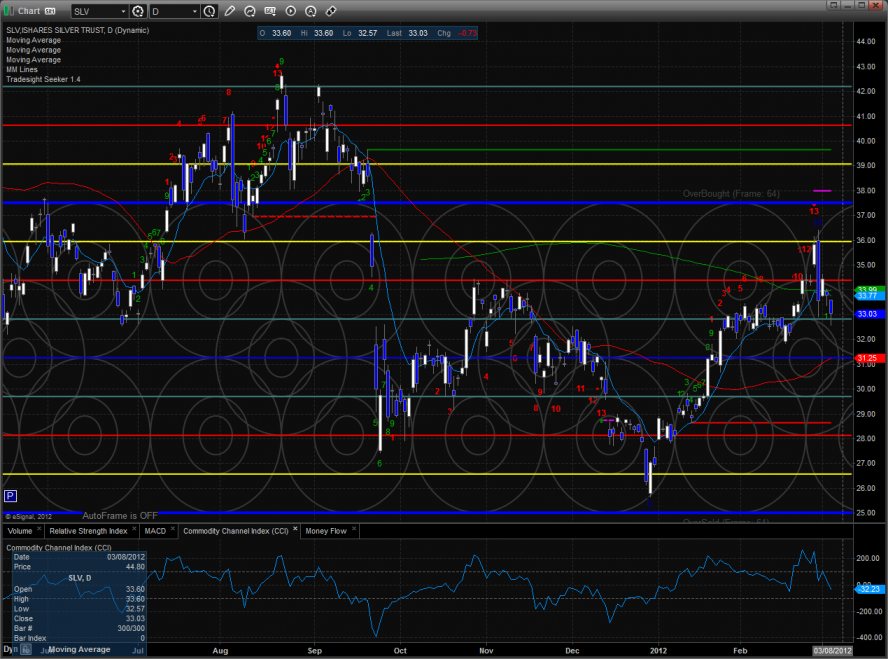
SLV:
Tradesight.com Market Preview for 3/6/12
The ES continues to have trouble with the 8/8 level and Monday gave back 4 handles. Price settled right on the important 10ema. A close below this level would be the first sign of a short-term change in trend.

The NQ futures we also lower on the day and settled right around the 10ema. Keep in mind that the Seeker 9-13-9 pattern has not yet released any of its energy to the downside. The first target after a CIT will be the active static trend line around 2550.

Multi sector daily chart:

The 10-day Trin is still neutral:

The SOX/NDX cross pair took a huge hit. A break to a new low would be bearish and likely break the broader NDX100.

The NDX/SPX cross is also flashing a warning sign. The chart has yet to produce a new high where the relative strength of the NDX could really assert itself and now it could possibly be rolling over. A break under 1.90 will be the deal breaker.

The XOI was the best performing sector. It was lower on the day by a fraction but bullishly closed near the high.

The BKX is still range bound but there is still an active Seeker sell signal that has yet to influence price.

The OSX is backing off and should find better support after it gets back into the pattern and near the moving averages which are all in the same price neighborhood.

The BTK continues to roll over and is getting closer to first support at the static trend line (red). Keep in mind that with the gap on the chart the static trend line level is very important and will be an important break level if breeched.

The XAU offered little safety and was much weaker than the major averages on the day. The chart continues to print lower high after lower high.

The SOX was the last laggard on the day and broke through the neck line of the head and shoulders pattern. This projects price roughly down to the midpoint of the trend channel for the typical H & S measured move.

Oil:

Gold:

SLV:

Stock Picks Recap for 3/5/12
With each stock's recap, we will include a (with market support) or (without market support) tag, designating whether the trade triggered with or without market directional support at the time. Anything in the first five minutes will be considered WITHOUT market support because market direction cannot be determined that early.
From the report, FSLR triggered short (without market support due to opening five minutes) and worked great:

In the Messenger, AMZN triggered long (without market support) and worked:

Rich's LULU triggered short (with market support) and worked:

Rich's SFLY triggered short (with market support) and worked enough for a partial:

His AAPL triggered short (with market support) and worked great:

His PCLN triggered short (with market support) and didn't work:

His SHLD triggered short (with market support) and didn't work:

His SODA triggered short (with market support) and didn't work:

AMZN triggered long (with market support) and worked enough for a partial:

In total, that's 7 trades triggering with market support, 4 of them worked, 3 did not.
Introduction to the Tradesight Seeker Market Timer
The Tradesight SEEKER has been designed to warn traders of high probability inflection points. An effective market timing tool such as the SEEKER has many benefits. It may keep a winning trade in position longer and increase profits or it may spot a reversal point to enter a trade.
All traders are familiar with both the price and time axis on a chart. Unfortunately, many traders under-utilize the horizontal time axis. The SEEKER is a pattern recognition tool that evaluates both time and price.
There are two main components in the SEEKER that represent different phases of a move. The first is a Setup ‘9’ which is momentum based and then followed by a Countdown ‘13’ which is trend based.
The momentum setup ‘9’ evaluates the bars on a chart that first show organized construction. In an uptrend, when a momentum move begins, the first recognized bar will be labeled with a green ‘1’ above the bar. Each successive bar that continues in the momentum move will be numbered until at least 9 bars have been consecutively labeled. Once 9 consecutive bars have been counted, price will typically either pause or retrace. This is useful information for either managing open positions or evaluating levels for entries.
After a momentum move has been identified by the 1 through 9 bar count, the second phase of evaluation may commence. The countdown ‘13’ phase will begin to evaluate the trend and look for construction that will terminate when a total of 13 new candles have met the trend criteria for both time and price. After the 13th bar of the trend phase, traders will be on high alert for significant price reversal.
The two distinct phases of the SEEKER are the setup momentum 9 bar move and then the subsequent trend countdown 13 bar move.
Below is a 65-minute intraday chart of Lululemon (LULU). At the left of the chart there is a 9 bar momentum move (green numbers above candles) that ran for about $2.00 before retracing, consolidating, and resting. After the completion of the 9 bar run, the second phase of the tool began numbering the 13 trend exhaustion move with red numbers. This part of the study ran for about $4.50 before marking the chart with the red ‘13’ and red exhaustion arrow. The ‘13’ trend exhaustion phase reversed price and produced a wave of profit taking. The value of the Seeker here is that it kept traders long and correctly identified the reversal candle on the chart:

Both the 9 bar momentum phase and the 13 trend exhaustion phase of the SEEKER study provide real time objective information. Not only does the study do on the fly intraday reconnaissance, but it works in all time frames all the way up to the large weekly charts. The SEEKER study produced a daily time frame sell signal on 3/1/12.
Forex Calls Recap for 3/5/12
A nothing session to start the week. See EURUSD below.
Here's the US Dollar Index intraday with our market directional lines:

New calls and Chat tonight.
EURUSD:
Triggered short at A and stopped. At least some pieces of the trade triggered long at B depending on how you followed our order staggering rules. This didn't go anywhere and never broke under the UBreak to get stopped, so I closed it at C for the end of the session:

Tradesight February 2012 Forex Results
Before we get to February’s numbers, here is a short reminder of the results from January. The full report from January can be found here and you can get the last several months in a row vertically by clicking here and scrolling down.
Tradesight Pip Results for January 2012
Number of trades: 32
Number of losers: 16
Winning percentage: 50%
Worst losing streak: 6 in a row (around January 4-8 and again late in month)
Net pips: +330
Reminder: Here are the rules.
1) Calls made in the calendar month count. In other words, a call made on August 31 that triggered the morning of September 1 is not part of September. Calls made on Thursday, September 30 that triggered between then and the morning of October 1 ARE part of September.
2) Trades that triggered before 8 pm EST / 5 pm PST (i.e. pre Asia) and NEVER gave you a chance to re-enter are NOT counted. Everything else is counted equally.
3) All trades are broken into two pieces, with the assumption that one half is sold at the first target and one half is sold at the final exit. These are then averaged. So if we made 40 pips on one half and 60 on the second, that’s a 50-pip winner. If we made 40 pips on one half, never adjusted our stop, and the second half stopped for the 25 pip loser, then that’s a 7 pip winner (15 divided by 2 is 7.5, and I rounded down).
4) Pure losers (trades that just stop out) are considered 25 pip losers. In some cases, this can be a few more or a few less, but it should average right in there, so instead of making it complicated, I count them as 25 pips.
5) Trade re-entries are valid if a trade stops except between 3 am EST and 9 am EST (when I’m sleeping). So in other words, even if you are awake in those hours and you could have re-entered, I’m only counting things that I would have done. This is important because otherwise the implication is that you need to be awake 24/6. Triggers that occur right on the Big Three news announcements each month don’t count as you shouldn’t have orders in that close at that time.
You can go through the reports and compare the breakdown that I give as each trade is reviewed.
Tradesight Pip Results for February 2012
Number of trades: 30
Number of losers: 13
Winning percentage: 56.7%
Worst losing streak: 3 in a row (start of the month)
Net pips: +70
February was not a great month for Forex. To start with, ranges dropped sharply. The 6-month average daily ranges on the EURUSD and GBPUSD dropped 10 pips each during the month. When you realize that you are averaging six months of data, a 10-pip drop is significant. Smaller ranges are bad for us as traders. This was also a short month (29 days with a Holiday), the shortest month of the year. In addition, we had FOUR trades during the month that triggered in the morning and that we closed at the end of the session because they were right around the entry, so they hadn't stopped or hit the first target. This almost never happens.
That said, we did end up with a positive month, although nothing extraordinary compared to many other months. It still proves that the system works, as we won 56% of our 30 trades and kept the losers tight as usual. Not much else to say except that I hope the ranges expand again and we can get back to a more normal environment soon. It is somewhat shocking that we ended up nowhere with so much going on in Europe with the bailout.
