Stock Picks Recap for 7/8/11
With each stock's recap, we will include a (with market support) or (without market support) tag, designating whether the trade triggered with or without market directional support at the time. Anything in the first five minutes will be considered WITHOUT market support because market direction cannot be determined that early.
We had a lot of calls between the report and the Messenger, but amazingly, very few triggers with the gap and flat day (until late).
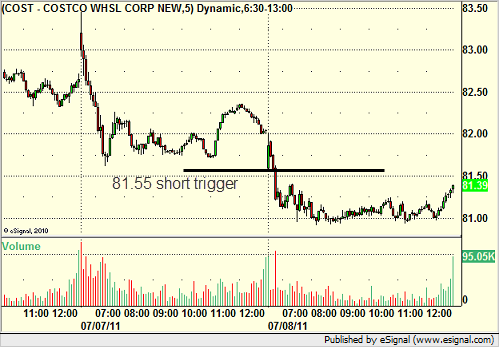
Nothing triggered off of the main report. From the Messenger, COST triggered short (without market support) and worked great:

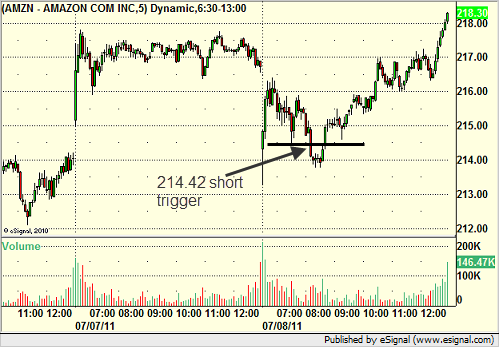
AMZN triggered short (with market support) and worked enough for a partial:

In total, that's only 1 trade triggering with market support, and it worked.
Forex Calls Recap for 7/8/11
Another winner in the EURUSD to close the week (half size ahead of NFP). See that section below.
As usual on the Sunday report, we'll look at the action from Thursday night/Friday, then look at the daily charts heading into the new week, and then discuss the US Dollar Index.
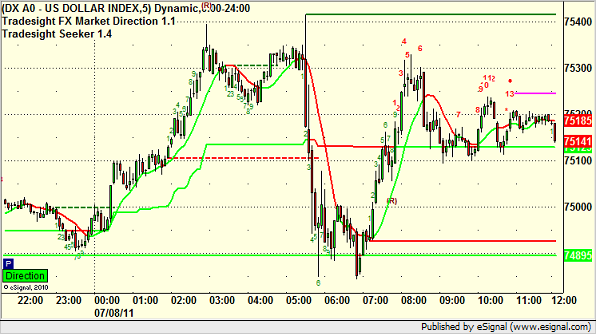
Here's the Dollar Index intraday with our market directional tool lines:

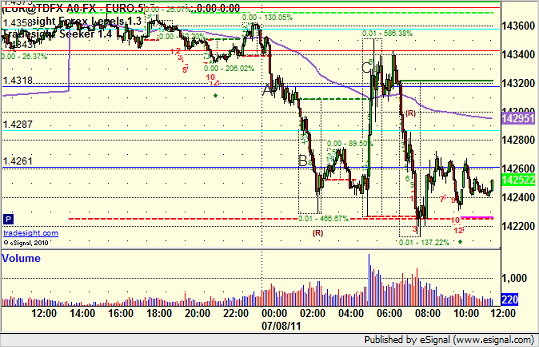
EURUSD:
Triggered short at A, hit first target at B, second half stopped at C unless you were awake overnight to tighten the stop:

Tradesight Market Preview for 7/7/11
The market did very little, both consolidating last week’s huge gain and marking time before the Friday NFP number. Nothing new technically besides holding and not retracing last week’s explosion.

Naz was slightly stronger than the SP gaining 3 handles, settling right at the 8/8 level.

Multi sector daily chart:

The 10-day Trin remains neutral, neither overbought nor oversold.

The TRAN closed right at the previous (all time) high. Be sure to overweight this sector for long ideas once it breaks out.

The XAU continues its bounce towards the 50% fib.

The XAL outperformed the broad market, a break above 43.50 puts 46.50 in play off the “W” bottoming formation.

BTK blah…….

The OSX is most likely gathering energy to push above the static trend line.

The BKX is still trapped within the current downtrend.

The SOX like the BTK is still trapped within the downtrend. Note that a breakout of the channel will also break above the 50dma and could have a good deal of power.

Oil was little changed after yesterday’s breakout.

Gold is moving into key overhead:

Stock Picks Recap for 7/6/11
With each stock's recap, we will include a (with market support) or (without market support) tag, designating whether the trade triggered with or without market directional support at the time. Anything in the first five minutes will be considered WITHOUT market support because market direction cannot be determined that early.
From the report, WYNN triggered long (without market support) and spiked about a point for a partial. It did work overall later in the session as the market came back:

TIBX triggered long (with market support) and worked:

FFIV triggered long (with market support) and worked:

In the Messenger, GOOG triggered long (without market support due to opening five minutes) and worked:

Rich's SINA triggered short (without market support) and didn't work:

His NFLX triggered short (without market support) and went about $0.50:

His GS triggered short (with market support) and didn't work:

AKAM triggered long (without market support) and didn't work:

AMZN triggered short (with market support) and worked enough for a partial:

RIMM triggered short (with market support) and worked enough for a partial:

Rich's afternoon RIMM call triggered short (without market support) and worked a little:

In total, that's 5 trades triggering with market support, 4 of them worked, 1 did not.
Forex Calls Recap for 7/6/11
Another interesting session as our EURUSD trade continued, and we added a winner and loser in the GBPUSD. See below.
Here's the US Dollar Index intraday with our market directional tool:

New calls and Chat tonight, but we have rate announcements out of Europe and the Bank of England overnight. NFP data Friday morning too.
EURUSD:
Our prior day's short came up to hit our UBreak stop at A and B but never got through enough for the stop. Lowered stop several times during the session and currently holding with stop a few pips over 1.4525:

GBPUSD:
Triggered long at A and stopped. Triggered short at B, hit first target at C, and closed final piece at D:

How the US Dollar Got Here
There are benefits to having a weak US Dollar…up to a point. Weak currencies are supposed to encourage exports. Other countries see our goods as cheap when adjusted for currency exchange and buy our products. That’s a solid economic theory…assuming certain factors are held steady.
This theory implies that we are a producing society. We are not anymore. We produce very little. Most of our manufacturing has been outsourced to Asia and countries near Asia. We maintain, for the most part, a technology industry and a defense industry, although the technology industry in many ways manufactures abroad.
The economics and politics of the US Dollar rely on certain assumptions, and I would argue that in the last decade, the assumptions were faulty. The old rules don’t apply. We used to manufacture and sell goods to the world. When that was the case, in times of slowdown, a weaker Dollar would spur sales. That doesn’t work in today’s global realities. Let’s take a look at the US Dollar Index from three different timeframes and comment both on what it is doing and what the charts mean. And remember…charts don’t lie, people do.
Here is the last year and a little more on the US Dollar Index:

If you looked solely at that chart, you might make a few assumptions. It shows clearly that we are in a very short term uptrend, have recently broken the intermediate-term downtrend line, and are struggling with the longer-term downtrend line (at least on this timeframe). This chart certainly makes the US Dollar look weak, which would be the result of either bad or intentional policy to drive it lower on our part.
Having said that, let’s now back out the picture to a weekly chart that shows several years of data and see what that indicates:

In this timeframe, things don’t look as bad. We have a clear 5-6 year downtrend, but the trendline is fairly flat. We have a clear 2-3 year intermediate-term uptrend line that was recently broken to the downside. And we have a clear short-term downtrend (which was the longer-term line on the prior chart) that is resistance. From all three angles, we are in a downtrend, but it certainly doesn’t appear as steep as it looked on the prior chart. In fact, we haven’t made a new low since early 2008.
Now let’s back the chart out to a monthly chart that dates back to the 1980s:

Here we get a very different view of the US Dollar, but what happens is that the really long-term picture clarifies how much our Federal government policy matters. Here, I’m not worried about trend lines. I’m more focused on the highs and lows. Remember that in the 1980s and into the early 1990s, we followed Republican economic politics, which cut taxes while increasing spending and accruing huge deficits. This was clearly a negative for the US Dollar, but it also came at a time where the US manufacturing sector was much stronger and more prominent than it is today. If you look at the end of 1992, the US Dollar bottomed right at the election (on Election Day, no less) of President Clinton. This led to an 8-year rally on the Dollar that was driven by lowering the annual deficit and topped out in annual surpluses. The only blip in that run was the period where the Federal government almost shut down over a budget impasse (in fact, it did for a few days). Other than that period (ahem…sound familiar); INSERT INTO `wp_posts` (`ID`, `post_author`, `post_date`, `post_date_gmt`, `post_content`, `post_title`, `post_category`, `post_excerpt`, `post_status`, `comment_status`, `ping_status`, `post_password`, `post_name`, `to_ping`, `pinged`, `post_modified`, `post_modified_gmt`, `post_content_filtered`, `post_parent`, `guid`, `menu_order`, `post_type`, `post_mime_type`, `comment_count`) VALUES the Dollar got stronger and played a major role in our prosperity.
The chart then almost tops out on Election Day 2000, although it makes one additional push that is capped at 9/11. The next eight years is a solid decline as the country returned to the notion that we can spend on wars and everything else while lowering taxes and paying for nothing. The difference is that in the two decades since that policy had been implemented the previous time, we outsourced our manufacturing jobs and had nothing to sell. The combination proved deadly for the economy, the stock market, and employment. As I said at the top, a weak Dollar has its benefits, in a certain scenario. We aren’t in that scenario.
What the Index has said since 2008 is that we’re trying to get back on track. We need to get the economy moving again, bring jobs back home (a step that isn’t really being addressed); INSERT INTO `wp_posts` (`ID`, `post_author`, `post_date`, `post_date_gmt`, `post_content`, `post_title`, `post_category`, `post_excerpt`, `post_status`, `comment_status`, `ping_status`, `post_password`, `post_name`, `to_ping`, `pinged`, `post_modified`, `post_modified_gmt`, `post_content_filtered`, `post_parent`, `guid`, `menu_order`, `post_type`, `post_mime_type`, `comment_count`) VALUES and only after that, get our fiscal house in order. The fact that the US Dollar bottomed in 2008 suggests that the market believed that that would be the direction that we would take. But here again, at a crucial junction, instead of looking to get our house in order and get our spending AND revenues in line, we’re flirting with the debt ceiling and shutting down the government, something that nearly killed the recovery in 1995.
When you really examine the long-term chart of the US Dollar, it becomes clear that it is about fiscal policy and not just the ebb and flow of the economy. The reality is that today, we don’t have an economy that thrives on a weak Dollar, and we’re in trouble if we don’t recognize that and prevent it from going much lower.
How the US Dollar Got Here
There are benefits to having a weak US Dollar…up to a point. Weak currencies are supposed to encourage exports. Other countries see our goods as cheap when adjusted for currency exchange and buy our products. That’s a solid economic theory…assuming certain factors are held steady.
This theory implies that we are a producing society. We are not anymore. We produce very little. Most of our manufacturing has been outsourced to Asia and countries near Asia. We maintain, for the most part, a technology industry and a defense industry, although the technology industry in many ways manufactures abroad.
The economics and politics of the US Dollar rely on certain assumptions, and I would argue that in the last decade, the assumptions were faulty. The old rules don’t apply. We used to manufacture and sell goods to the world. When that was the case, in times of slowdown, a weaker Dollar would spur sales. That doesn’t work in today’s global realities. Let’s take a look at the US Dollar Index from three different timeframes and comment both on what it is doing and what the charts mean. And remember…charts don’t lie, people do.
Here is the last year and a little more on the US Dollar Index:

If you looked solely at that chart, you might make a few assumptions. It shows clearly that we are in a very short term uptrend, have recently broken the intermediate-term downtrend line, and are struggling with the longer-term downtrend line (at least on this timeframe). This chart certainly makes the US Dollar look weak, which would be the result of either bad or intentional policy to drive it lower on our part.
Having said that, let’s now back out the picture to a weekly chart that shows several years of data and see what that indicates:

In this timeframe, things don’t look as bad. We have a clear 5-6 year downtrend, but the trendline is fairly flat. We have a clear 2-3 year intermediate-term uptrend line that was recently broken to the downside. And we have a clear short-term downtrend (which was the longer-term line on the prior chart) that is resistance. From all three angles, we are in a downtrend, but it certainly doesn’t appear as steep as it looked on the prior chart. In fact, we haven’t made a new low since early 2008.
Now let’s back the chart out to a monthly chart that dates back to the 1980s:

Here we get a very different view of the US Dollar, but what happens is that the really long-term picture clarifies how much our Federal government policy matters. Here, I’m not worried about trend lines. I’m more focused on the highs and lows. Remember that in the 1980s and into the early 1990s, we followed Republican economic politics, which cut taxes while increasing spending and accruing huge deficits. This was clearly a negative for the US Dollar, but it also came at a time where the US manufacturing sector was much stronger and more prominent than it is today. If you look at the end of 1992, the US Dollar bottomed right at the election (on Election Day, no less) of President Clinton. This led to an 8-year rally on the Dollar that was driven by lowering the annual deficit and topped out in annual surpluses. The only blip in that run was the period where the Federal government almost shut down over a budget impasse (in fact, it did for a few days). Other than that period (ahem…sound familiar); INSERT INTO `wp_posts` (`ID`, `post_author`, `post_date`, `post_date_gmt`, `post_content`, `post_title`, `post_category`, `post_excerpt`, `post_status`, `comment_status`, `ping_status`, `post_password`, `post_name`, `to_ping`, `pinged`, `post_modified`, `post_modified_gmt`, `post_content_filtered`, `post_parent`, `guid`, `menu_order`, `post_type`, `post_mime_type`, `comment_count`) VALUES the Dollar got stronger and played a major role in our prosperity.
The chart then almost tops out on Election Day 2000, although it makes one additional push that is capped at 9/11. The next eight years is a solid decline as the country returned to the notion that we can spend on wars and everything else while lowering taxes and paying for nothing. The difference is that in the two decades since that policy had been implemented the previous time, we outsourced our manufacturing jobs and had nothing to sell. The combination proved deadly for the economy, the stock market, and employment. As I said at the top, a weak Dollar has its benefits, in a certain scenario. We aren’t in that scenario.
What the Index has said since 2008 is that we’re trying to get back on track. We need to get the economy moving again, bring jobs back home (a step that isn’t really being addressed); INSERT INTO `wp_posts` (`ID`, `post_author`, `post_date`, `post_date_gmt`, `post_content`, `post_title`, `post_category`, `post_excerpt`, `post_status`, `comment_status`, `ping_status`, `post_password`, `post_name`, `to_ping`, `pinged`, `post_modified`, `post_modified_gmt`, `post_content_filtered`, `post_parent`, `guid`, `menu_order`, `post_type`, `post_mime_type`, `comment_count`) VALUES and only after that, get our fiscal house in order. The fact that the US Dollar bottomed in 2008 suggests that the market believed that that would be the direction that we would take. But here again, at a crucial junction, instead of looking to get our house in order and get our spending AND revenues in line, we’re flirting with the debt ceiling and shutting down the government, something that nearly killed the recovery in 1995.
When you really examine the long-term chart of the US Dollar, it becomes clear that it is about fiscal policy and not just the ebb and flow of the economy. The reality is that today, we don’t have an economy that thrives on a weak Dollar, and we’re in trouble if we don’t recognize that and prevent it from going much lower.
Tradesight Market Preview for 7/6/11
The SP did very little besides shake off and holdup in the teeth of a huge number of individual stocks 9 days up. There is a key level of resistance just overhead at the static trend line and the February high (old breakout).

Naz rallied to the key 8/8 level and in so doing has elevated the CCI to an over bought reading. It should be considered a show of strength that Monday’s close exceeded the high of the 9 bar run that completed Friday.

Multi sector daily chart:

The NDX has finally reasserted itself vs. the SPX. If this condition continues, this is a very bullish development for equities.

The OSX continues to show good relative strength vs. crude futures. This is bullish for crude.

The SOX is still underperforming the NDX which will be a drag on the Naz if the divergence continues.

The XAU is badly lagging the underlying the gold futures. This is a bearish divergence and should keep a lid on the price of gold.

The XAU was top gun on the day;

The OSX touched but did not clear the active static trend line. Note that the move is only 5 days up.

The BTK was held down by the completed 9 bar setup.

The Transports took a breather after recording a new high close on Friday. Set an alarm for a break over 5567 which would be a new high water mark.

The SOX has resistance/break out level at 420.

The BTK has a key break just overhead which will confirm that the chart has turned positive.

Oil broke the short term downtrend.

Gold bounced but has considerable overhead to work through.

Stock Picks Recap for 7/5/11
With each stock's recap, we will include a (with market support) or (without market support) tag, designating whether the trade triggered with or without market directional support at the time. Anything in the first five minutes will be considered WITHOUT market support because market direction cannot be determined that early.
From the report, JAZZ triggered long (with market support) and worked:

CERN triggered long (with market support) and didn't go more than a few cents either way, so doesn't count either way:

In the Messenger, Rich's GOOG triggered long (with market support) and didn't work:

There were several other calls, but none of them triggered on a dead day in the market.
In total, that's 2 trades triggering with market support, 1 of them worked, 1 did not.
Forex Calls Recap for 7/5/11
Nice start to the week. Winners in EURUSD and GBPUSD, although we also had one stop out on GBPUSD. See both sections in the report below for the review.
Here's the US Dollar Index intraday with market directional lines:

New calls and Chat tonight with only three days left for the week.
EURUSD:
Triggered short at A, hit first target at B, holding position with stop over S1:

GBPUSD:
Calls for the European session triggered short at A and stopped. Triggered long at B, hit first target at C, raised stop under Pivot and stopped at D:

