Forex Calls Recap for 4/6/11
US Dollar got weaker and we had a clean winner in the EURUSD that gave you hours to enter. See below.
Here's the US Dollar Index intraday with market directional:

EURUSD:
Triggered long at A, gave you hours until B to enter, hit first target at C, currently have stop under R2 for second half:

Tradesight Market Preview for 4/7/11
The SP tested the waters above the recent range but was rejected and settled below the open but up 2 handles on the day. The same technical condition persists in that only a close outside of the recent range will define a directional bias.

Naz was also higher on the day by 2 handles. Price remains just above the key 10 and 50dmas.

Multi sector daily chart:

The 10-day Trin broke below the 1.00 baseline, neither overbought nor oversold.

The SOX was top gun, closing at a new high on the move and challenging the 50dma. Note that today’s candle was a price flip and the setup phase now stands at one.

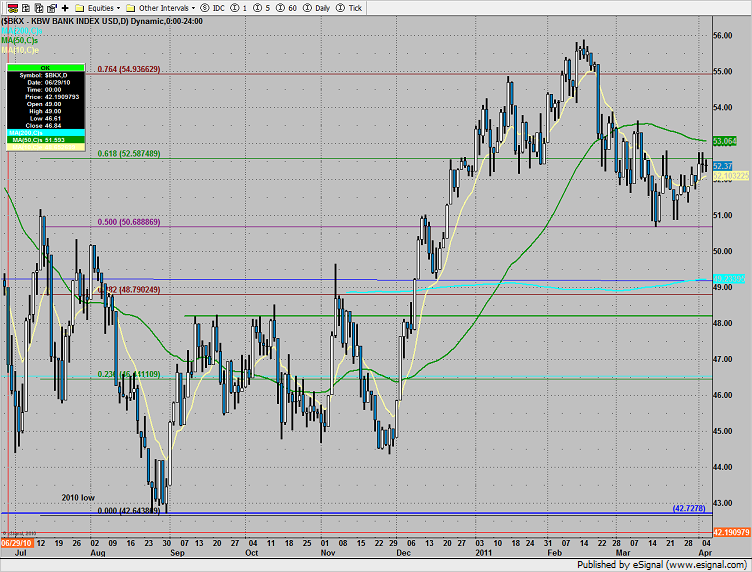
The BKX posted a similar day, breaking above the 50dma.

The BKX closed at a new high on the move and is still well shy of the 100% measured move target.

The XAU tried for higher prices but didn’t have much to show at the close. This was the dreaded measuring day that we were prepared for following yesterday’s range expansion candle. Thursday is a higher probability upside day, especially if price gaps lower over night.

The OSX was the last laggard, decisively breaking below the recent tight trading range. The Seeker exhaustion signal is still active.

Oil:

Gold:

COT 4-01-11
Hi Traders,
Well, I was swamped last week so I never got to the COT. No matter, with Non-Farm Payrolls out on Friday, I don't think it was that big of a deal; and, the previous week's report sufficed just fine.
About the COT and coming up-to-speed, Let's get busy. The latest charts ae here: https://tradesight.com/wp-content/uploads/2011/04/COT-4-01-111.pdf
The commodity currencies have been climbing and the NZD has moved 5% in two weeks. That's just ridiculous. But, the pair is at a .786 Fibonacci retracement level per the last daily chart high and low, and is pretty much overbought. I'm watching closely to see if it moves lower, retracing to a Fibonacci level of the last leg up. Correlate this with the COT chart, and you'll find the kiwi WAS at extremes: the commercials and specs are 180-degrees apart, where the commercials had been buyers and specs sellers. But this changed two-weeks ago and the COT gave us a heads up. So, even with NZD at the current .786 Fibonacci level, if it does move lower from here, I believe it is temporary (and, again, will be a retrace of this last leg up). Also note the daily trend line hasn't been so much as tested. Hence, the trend is still up.
The aussie is also at extremes, with the commercials net short and the specs net long. And, based on the COT and price charts, I'm looking for AUD to make a nice move down from these highs. CAD looks the same, but the inverse is true, i.e., I looking for is to move up. Like NZD, note the daily trend lines for both remain untested, at this point. So, conservative and/or longer term traders might want to wait for confirmation signals before taking a position. Just a thought and this totally depends on one's style of trading.
The swissy and euro are in a similar, but inverse, situation. And, when looking at the USD Index, both appear close to a turn around. Note the commercials and specs are 180-degrees out on the Index, which, as I've mentioned in the past, presages a USD turn-around. Yes, I know everyone hates the greenback, but guess what?
I'm not "everyone" and neither are you. We're a lot smarter and prefer to think contrarain, right?
Right ;- )
About the yen, well.... I'm not a fan of interventions, so I'm going to leave this one alone. Other than carry trades (playing the interest rate differential); INSERT INTO `wp_posts` (`ID`, `post_author`, `post_date`, `post_date_gmt`, `post_content`, `post_title`, `post_category`, `post_excerpt`, `post_status`, `comment_status`, `ping_status`, `post_password`, `post_name`, `to_ping`, `pinged`, `post_modified`, `post_modified_gmt`, `post_content_filtered`, `post_parent`, `guid`, `menu_order`, `post_type`, `post_mime_type`, `comment_count`) VALUES one may very well be living on the edge by trading the yen. You just never know when you'll get a price spike, which, if you're on the wrong side of the trade, may feel like a spike in the forehead. I'm just sayin'....
Gold and silver? Momentum is slowing to the upside, but gold's COT shows the commercials selling and the specs buying. As for silver, its COT is pretty much a plate of spaghetti. Yes, per the price charts, it's still a long. But, we'll see where it goes, as it is overbought and (as I already mentioned) momentum is slowing.
That's it for this week. Feel free to comment.
Be well and good trading!
Clay
Tradesight Market Preview for 4/6/11
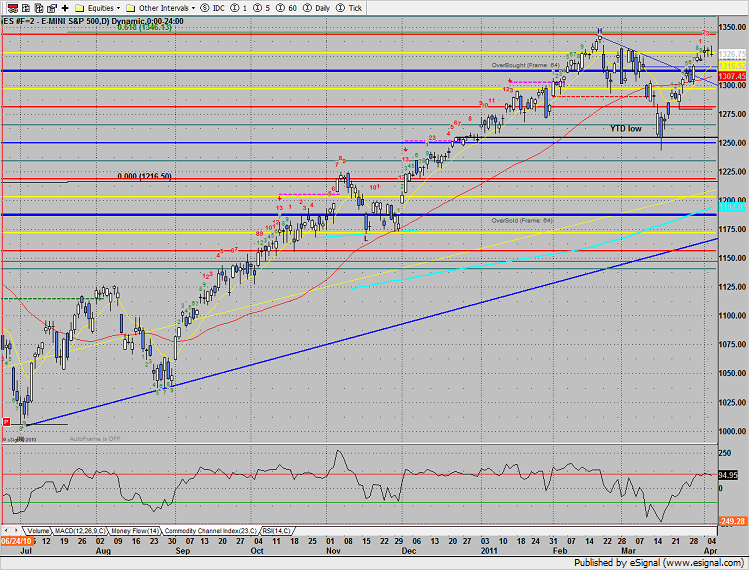
The SP remains trapped in the recent range. Intraday, price swept the prior high but settled 2 handles lower on the day. Noting decisive can be determined until price exits the mini-range on a closing basis.
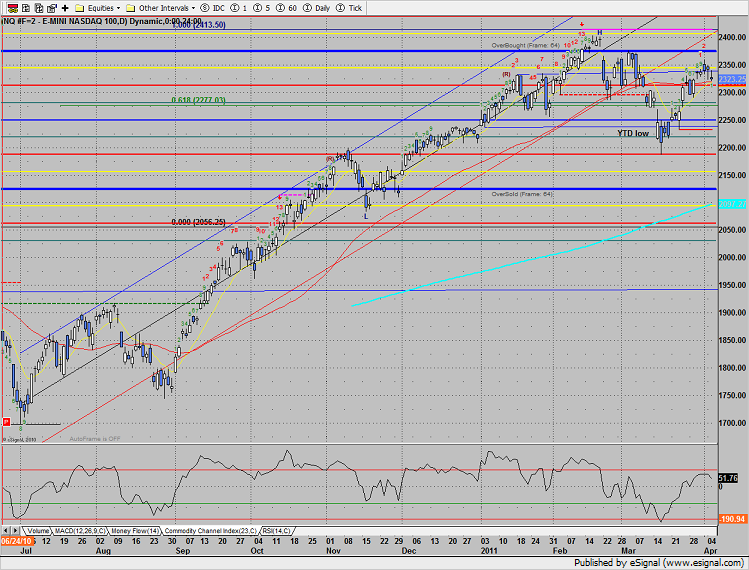
Naz was weaker by 17 on the day, settling right on the 10 and 50dmas. Note the relative weakness of the CCI on this bounce/retest. The relative weakness in the Naz vs. the SP is a problem for bull case in the market short term.
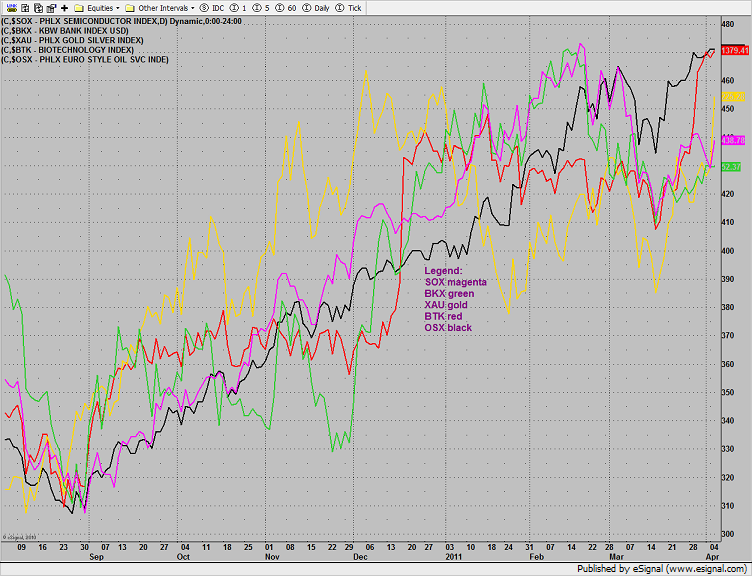
Multi sector daily chart shows the gold stocks coming on very strongly.
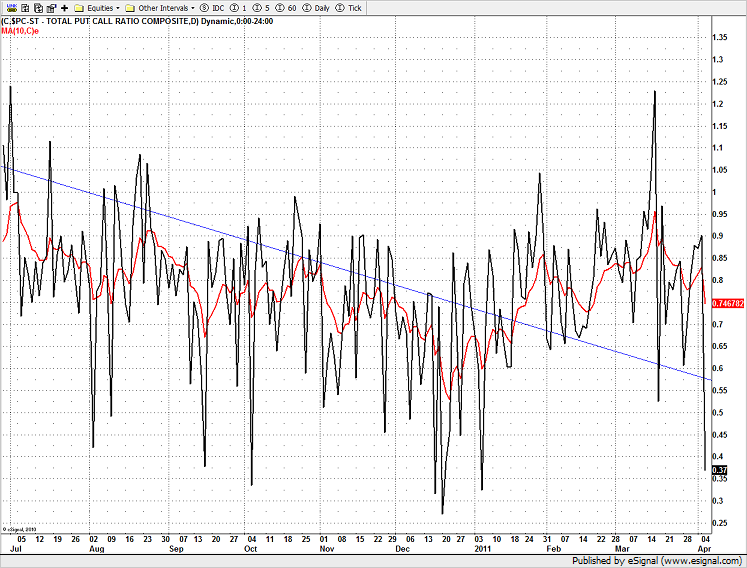
The put/call ratio took a decisive dive, implying extreme complacency.
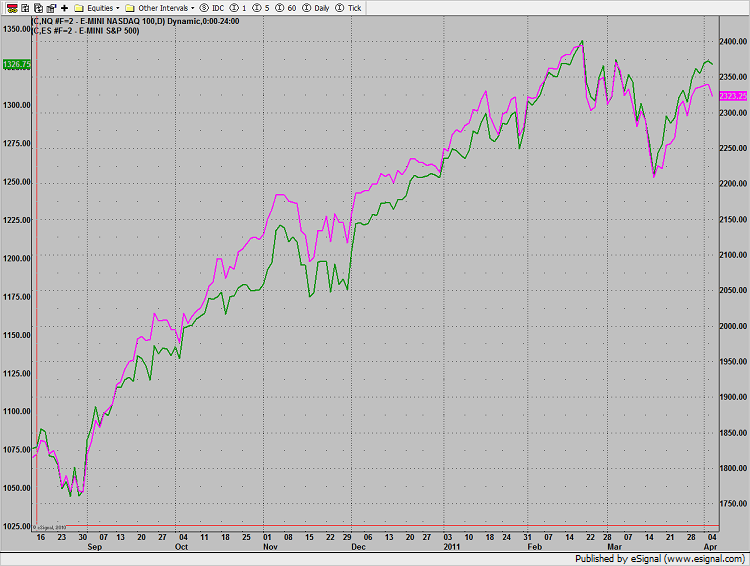
Naz continues to underperform the SP which is always concerning for the bulls. Naz is illustrated in the chart below in magenta.
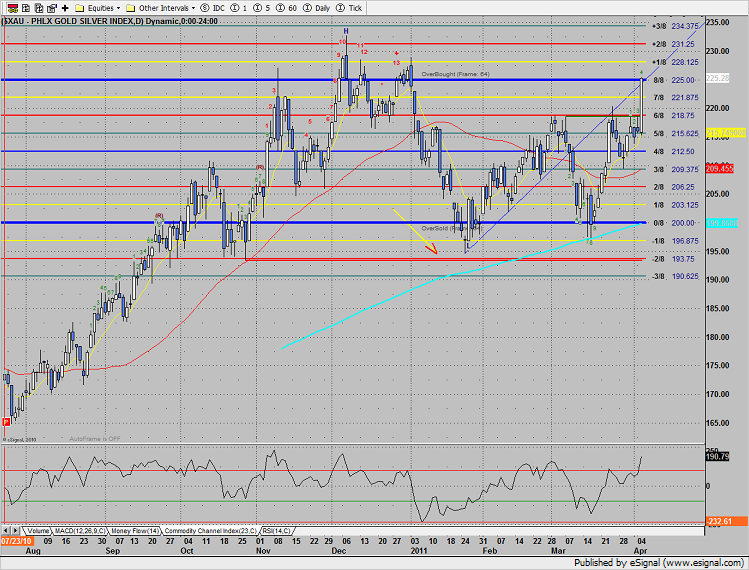
The XAU exploded through the static trend line to tag the 8/8 level. The gold shares were by far the strongest sector on the day. Such a strong impulse might need a measuring day before following through.
The SOX was the top gun of the “regular” sectors. Fueled by a takeover in the index, the semiconductors were higher but settled at the midpoint of the day.
The BTK was higher on the day but couldn’t break free from the gravity of the 8/8 Gann level.

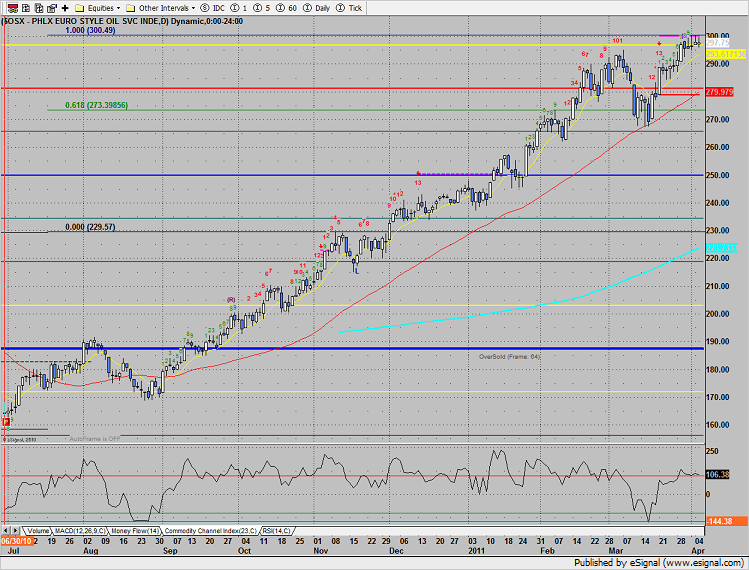
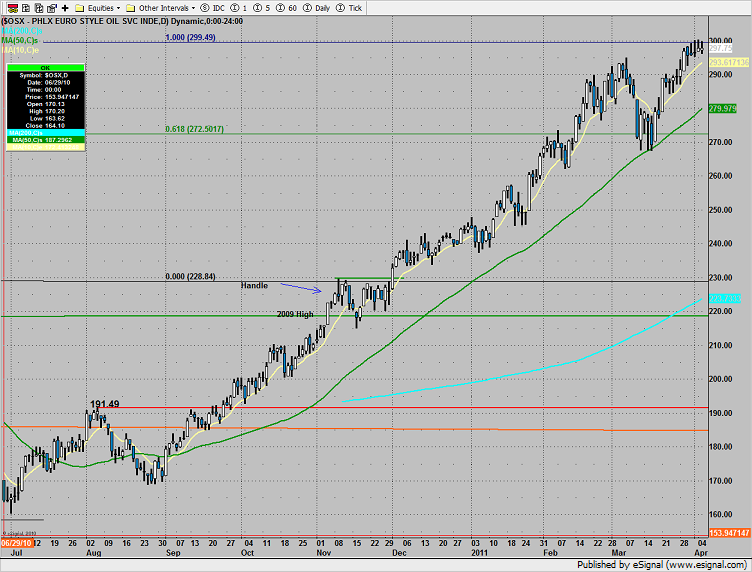
The OSX continues it’s tight trading range, still beneath the Seeker exhaustion risk level.
The BKX posted another indecisive candle on the chart, still below the down sloping 50dma.
Gold broke out to a new all-time high, the +2/8 level key resistance.

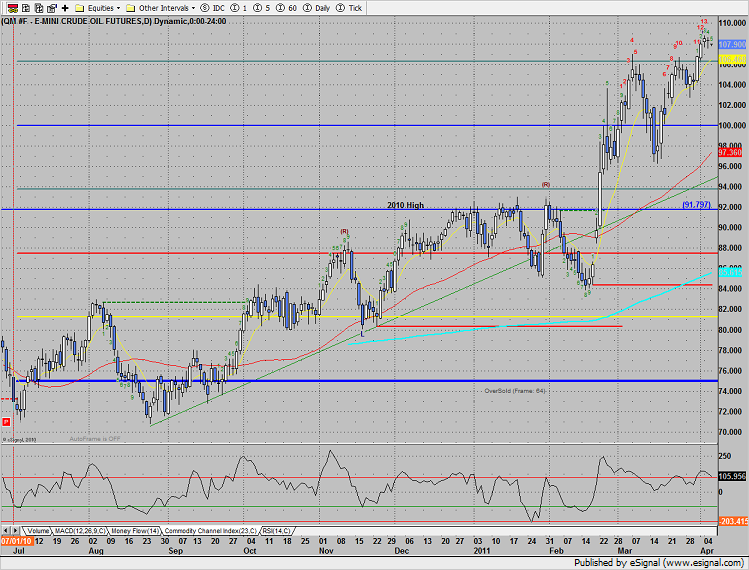
Oil was slightly lower on the day, the Seeker exhaustion signal is still active.
Stock Picks Recap for 4/5/11
With each stock's recap, we will include a (with market support) or (without market support) tag, designating whether the trade triggered with or without market directional support at the time. Anything in the first five minutes will be considered WITHOUT market support because market direction cannot be determined that early.
This was an unusual session in that volume was up, but market direction flipped several times, and a lot more trades than usual triggered without market support.
From the report, MCHP triggered long (with market support) and worked enough for a partial:

CBST gapped way over, no play.
In the Messenger, Rich's FFIV triggered short (without market support) and didn't work:

AMGN triggered long (with market support) and didn't work:

RIMM triggered short (without market support) and didn't work:

Rich's CREE triggered long (with market support) and worked enough for a partial:

His GOOG triggered short (with market support) and worked for a couple of points:

ERTS triggered long (with market support) and worked enough for a partial:

Rich's AU triggered long (with market support) and worked:

NFLX triggered short (without market support) and worked enough:

Rich's SLW triggered long (with market support) and worked enough:

In total, that's 7 trades triggering with market support, 6 of them worked, 1 did not.
Small Cap Picks Recap for 4/5/11
The first quarter of the year is a great time of year for the small cap sector because a lot of little stocks get the benefit of new IRA money. However, in general, the Russell 2000 index has been much stronger than the rest of the market, and we might see this continue now that we are passed the first quarter. We issue two small cap reports every week, and the trades that triggered off of the first report worked extremely well. The second report for the week has now been posted and included five new picks, but here is the summary from the first half of the week with the trigger lines drawn from the entry points that we gave in advance:
PDLI worked great:

PPHM gapped over the trigger, no play.
SMOD worked:

AKRX worked great:

SWSH, which was added via the Messenger for Tuesday over $6.85, worked great:

Forex Calls Recap for 4/5/11
Been a while, but we had a trigger hit on a major news spike that may have prevented most from getting an execution. See GBPUSD below. That is something that can happen in Forex.
Here's the US Dollar Index intraday with our market directional tool:

GBPUSD:
Triggered short at A and stopped. Triggered long at B, but on a big spike where your broker may or may not have filled you (or with bad slippage if you just used a stop); INSERT INTO `wp_posts` (`ID`, `post_author`, `post_date`, `post_date_gmt`, `post_content`, `post_title`, `post_category`, `post_excerpt`, `post_status`, `comment_status`, `ping_status`, `post_password`, `post_name`, `to_ping`, `pinged`, `post_modified`, `post_modified_gmt`, `post_content_filtered`, `post_parent`, `guid`, `menu_order`, `post_type`, `post_mime_type`, `comment_count`) VALUES hit first target at C, and should have raised stop later to D if you got any:

Tradesight March Forex Results...
Before we get to February’s numbers, here is a short reminder of the results from February. The full report can be found here.
Tradesight Pip Results for February 2011
Number of trades: 30
Number of losers: 12
Winning percentage: 60%
Worst losing streak: 4 in a row (February 16-18)
Net pips: +235
Reminder: Here are the rules.
1) Calls made in the calendar month count. In other words, a call made on August 31 that triggered the morning of September 1 is not part of September. Calls made on Thursday, September 30 that triggered between then and the morning of October 1 ARE part of September.
2) Trades that triggered before 8 pm EST / 5 pm PST (i.e. pre Asia) and NEVER gave you a chance to re-enter are NOT counted. Everything else is counted equally.
3) All trades are broken into two pieces, with the assumption that one half is sold at the first target and one half is sold at the final exit. These are then averaged. So if we made 40 pips on one half and 60 on the second, that’s a 50-pip winner. If we made 40 pips on one half, never adjusted our stop, and the second half stopped for the 25 pip loser, then that’s a 7 pip winner (15 divided by 2 is 7.5, and I rounded down).
4) Pure losers (trades that just stop out) are considered 25 pip losers. In some cases, this can be a few more or a few less, but it should average right in there, so instead of making it complicated, I count them as 25 pips.
5) Trade re-entries are valid if a trade stops except between 3 am EST and 9 am EST (when I’m sleeping). So in other words, even if you are awake in those hours and you could have re-entered, I’m only counting things that I would have done. This is important because otherwise the implication is that you need to be awake 24/6. Triggers that occur right on the Big Three news announcements each month don’t count as you shouldn’t have orders in that close at that time.
You can go through the reports and compare the breakdown that I give as each trade is reviewed.
Tradesight Pip Results for March 2011
Number of trades: 37
Number of losers: 18
Winning percentage: 51.3%
Worst losing streak: 3 in a row (twice)
Net pips: +190
Although we had more winners than losers, three of the trades for the month were +75, +55, and +55 pips after partial and final exit. That about totals the whole gain for the month. As usual, the strategy works fine even when the number of losers rises a bit if you end up letting some of the trades play out.
Ranges, however, continued to drop in the month, which has been the story. We had more days under average range, and the EURUSD and GBPUSD both dropped 4 points of average daily range during the month, which is a lot when you consider that we're taking six months of data into those averages. We did, however, see slight increases in ranges for pairs like the GBPJPY and EURJPY. Not everyone likes to trade the cross pairs, but they have been slightly more interesting on average.
The US Dollar remains at a critical point here and a move either way will likely start to see the ranges improve. We shall see. On to April...
Tradesight Market Preview for 4/5/11
The SP posted a very narrow range inside candle on the day, almost mirroring the session from Friday. This means there is nothing new technically but the break out of the 2 day range could have some punch.

Naz was a bit weaker than the broad market until it recouped losses late in the session. Index heavyweight AAPL was weak but did not break price lower. Key support is just below where the 10 and 50dmas converge.

Multi sector daily chart:

The 10-day Trin remains neutral, near the zero baseline.

The weekly cumulative NYSE advance/decline line is still very healthy and leading price. This condition will keep a safety net under the market until the a/d line begins to underperform. Keep in mind that the cumulative a/d line almost always leads price which means that the a/d line will have to rollover before a sustained market break is probable.

The OSX was top gun on the day and continues to have an active seeker exhaustion signal in play. The 100% Fibonacci extension remains resistance.

The XAU is still trapped under the active static trend line. A close above the 3/7/11 high puts 225 in play.

The BKX did very little closing unchanged.

The Biotech index posted a sloppy candle, settling right at the 8/8 area. The next fib price projection is 1407.

The SOX was very sloppy breaking down below the 10ema. Note that price is now counting down for a buy setup. After the bell there was a takeover announcement in the index so expect a gap up Tuesday.

Oil was higher on the day and recorded a 13 exhaustion signal:

Gold was higher but didn’t produce a new high close on the move.

Stock Picks Recap for 4/4/11
With each stock's recap, we will include a (with market support) or (without market support) tag, designating whether the trade triggered with or without market directional support at the time. Anything in the first five minutes will be considered WITHOUT market support because market direction cannot be determined that early.
From the report, QLIK triggered long (without market support) and worked enough for a partial:

XXIA triggered short (with market support) and worked:

In the Messenger, GS triggered short (without market support due to opening five minutes) and worked enough for an easy partial of $0.50:

BIDU triggered long (without market support) and worked great:

Rich's RVSN triggered short (with market support) and worked:

NFLX triggered short (with market support) and worked:

FSLR triggered short (with market support) and worked:

Rich's MCP triggered long (without market support) and worked enough for a partial:

In total, that's 4 trades triggering with market support, all 4 of them worked.
