A Classic Value Area Example on GBP/USD
For today's Blog commentary lesson/review, we wanted to show off a key play from last night's action that works about 70-80% of the time on a proper setup, which was the Value Area play on the GBPUSD. The main component here is that the pair started above the Value Area during the European session start (this chart is PST, but you can see volume as to when the European session started). Here is the 5-minute chart. The lines that we care about for this discussion are the light blue (or cyan) Value Area High and Value Area Low:
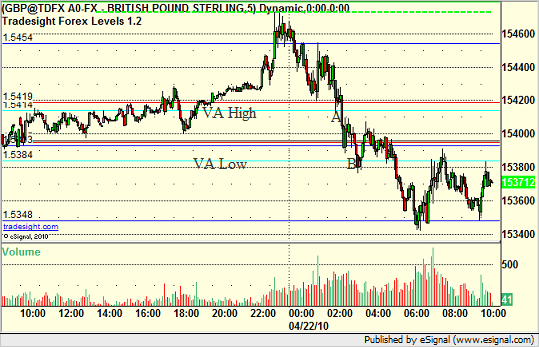
What you can see is that the pair came down to the Value Area High at A, which provides a short entry and a 70-80% chance that a move to the Value Area Low will occur. In this particular case, based on the prior day's ranges and the Levels as provided, we crossed 30 pips to the Value Area Low at B perfectly, and there was some initial support around that area.
Value Area plays are extremely easy to spot with the right tools and provide a simple strategy for traders with a basic stop entry and t/p target. Risk level should be half of the Value Area range.
Think that one was just a coincidence? How about the same concept on the NZDUSD last night, which triggered into the Value Area at A and crossed to the VAL at B for a perfect trade:
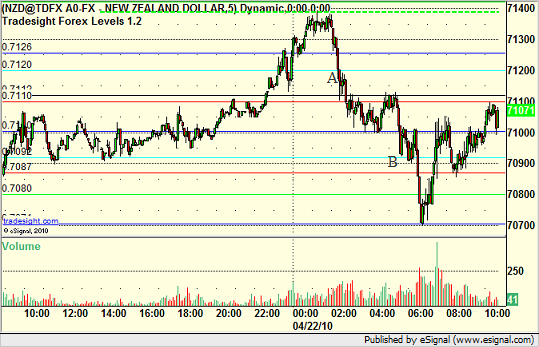
Note that the NZDUSD stopped right at the VAL at that point TO THE PIP. The market knows these numbers.
Follow us on Twitter or take a trial to our services for greater detail by clicking here.
A Unique Situation on the US Dollar Index
One thing that you rarely see in a Forex pair or the US Dollar Index is a gap. In fact, the only practical place where a gap could occur is between the Friday close and Sunday open.
What we do know from other markets is that from a technical perspective, the following are true:
80% of gaps fill the same day
95% of gaps fill within a week
99.5% of gaps fill eventually
Also, we know that when it comes to long-term trendlines, once they are well-established, if they break, they flip from support to resistance or vice versa on a retest.
At the moment, due to a rare gap in the Forex market from Sunday, April 11, we have a strange situation that combines the two concepts. Here's the daily chart of the US Dollar Index with a key trendline that had been critical support for some time:
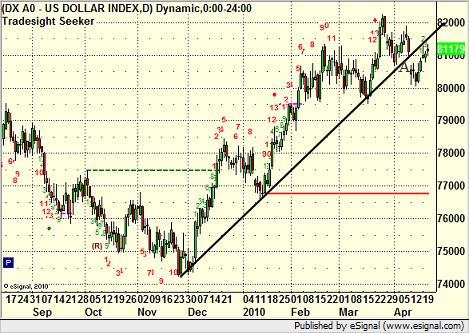
You can see the clear gap down under the trendline at point A. Now, trendlines are considered broken when they break due to price movement, not gaps. In this case, the market gapped down and over the course of the next week or so headed up to fill the gap. So we have met the 95% rule of filling the gap within about a week. However, this now leaves us using the trendline as resistance very clearly instead of support even though the line was not traded through on the downside. Some would call that a conundrum, and while it is extremely unusual and unique in the Forex market, it's probably worth noting how we play out over the next few days and which concept wins (gap fill or getting back above the trendline as it should still be support).
To learn more about Tradesight's market outlook, take a free trial here.
AUDUSD Breakout Looming?
We're currently tracking a key breakout in the daily chart of the AUDUSD over the 0.9406 level. There is a general inverted head and shoulders formation over six months forming here, which creates a lot of strength as the pair winds up for the breakout:
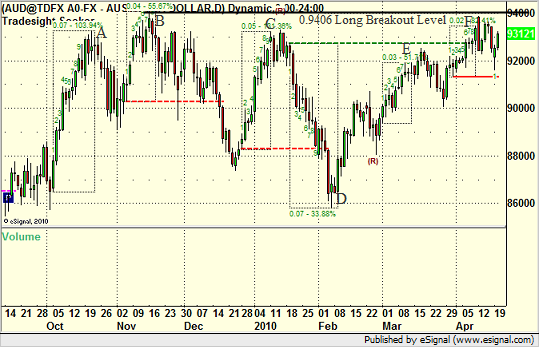
It is important to note that there is no trade until the breakout occurs. However, one key feature is our 9-bar counting indicator. On the chart, the bar counting method draws a dashed box around each count setup. The tool is generally designed to look for energy reversal points in the market. There are six boxes on the chart as shown.
Let's analyze what is occurring, starting with the first box to the left. This is a big box that terminated at point A on the chart and led to a reversal right from that point. The next box was a later turn up that stalled out at B, also a key turning point, and that created the breakout level that we are monitoring now.
Over a month later, we had another upward count that terminated at C and caused a downside reversal again in the pair. We then had the biggest setup count in the last six months to the downside, ending at point D on the chart. That's the biggest energy move, and the buy signal formed at the end of the box ends up being the low since then AND the head of the inverted head and shoulders.
What is the most interesting is that the second half of the pattern should be where strength really starts to build up, and the tool helps us spot that as well. Note that the counts that end at box E and F did not really lead to downside reversals on the AUDUSD. In other words, the AUDUSD is shaking off overbought energy as it heads toward the breakout of this pattern. That is a very critical component of the move and the setup. More details to come as the pattern plays out.
Tradesight Update
A few notes as we head into the week of April 19-23.
Here is a link to the video recap of last week's stock, small cap, and ETF calls along with a general overview of the action for the week.
In addition, we are in the process of adding a page to the site that details all of our current e-Signal tools. And we have reactivated the Blog for market commentary. More to come.
The GBPUSD, A Base, and a Gap to Fill
We saw some unique action that has led to an interesting setup in the GBPUSD to start the week. Sunday, the markets gapped in favor of the US Dollar on the open. This caused the GBPUSD to gap down between the S1 and S2 levels of the Pivot series. Gaps in Forex can only occur on Sundays, and this created an unusual starting place for the GBPUSD. As you can see from this chart, the initial impulse move after the gap was between S2 and S1 (points A and B on the chart):
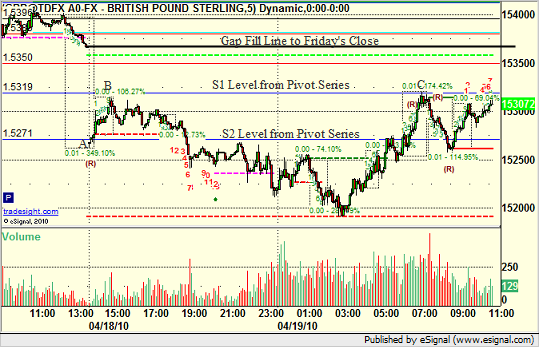
The pair later broke under S2, giving us a short entry that led to a profitable overnight trade. However, this morning, the GBPUSD has moved back between the S1 and S2 levels, and in fact, it hit S1 exactly at C.
This has created an intriguing base, almost a cup and handle, against the S1 level with a gap to fill way above. Gap fills occur 80% of the time on the same day that the gap is created, but they fill about 95% of the time within a week. Although the session is mostly over and volume has drifted off, we will be watching this area once the new Levels are created after 5 pm EST and looking for an entry into the gap over this prior S1 level. The gap fill itself would be the target.
It is very unusual to get such a setup in Forex, although we see them daily in stocks and futures.
Tradesight Messenger 2.0...
Tradesight Messenger 2.0 Release
This is something that is a long time coming. It takes a lot of money and programming effort to do something like this. We're about to launch an all-new website, and the Messenger is part of that launch. In fact, I wanted it done first.
I'm going to walk you through how to use this new Messenger, what is improved in it, and talk about some of its "special features." I have to say that I personally think that it is pretty darn cool.
The biggest complaint that customers have about Messenger 1.0 is that they have to have a web browser open to view the full message. This is no longer the case. Everything can be viewed quickly (much faster) and easily in Messenger 2.0. This includes the reports themselves.
The biggest complaint on MY end about Messenger 1.0 is that anyone can log in with a username from multiple computers. In other words, you can share the Messenger with someone else with your username. This is no longer the case. The Messenger only works on one machine at once. If you log in at home and then go to work and log in, the home version stops getting new messages. It's that simple.
The nice bonus about this new Messenger 2.0 is that it isn't just about Tradesight calls based on your subscription, although that is what you are paying for. Instead, it also is about news. You'll see what I mean.
So, I'm going to walk you through step by step how this Messenger works. The old Messenger 1.0 no longer works, so please follow these exact steps to get rid of it permanently.
1) Right-Click on the Tradesight Eyeball in the lower right corner of your screen (in the system tray). Hit Exit.
2) Start...Programs...Tradesight Messenger...Uninstall.
3) Reboot. The Messenger should not come up.
OK, so you install the Messenger from this link:
https://tradesight.com/rss/TradesightMessengerInstaller.exe
Just Run it and let it install. Then, you can run it from your Start...Programs...Tradesight Messenger folder. Keep in mind that this new Messenger does not automatically start each time you turn on your computer. You have to start it manually, or you can put it in Start...Programs...Startup, and then it will start each time.
When you run the program for the first time, note the new Tradesight logo and eyeball splash screen. We'll talk about that when the new website comes up.
You'll get a Messenger that basically says that no Feeds were found because no username is entered. Just hit Yes or OK.
Now, the Messenger is in front of you. Hit Edit...Preferences and put in your Tradesight username and password under the General option. Hit OK.
You should now see the Feeds for the subscriptions that you pay for, plus something called "Financial Feeds." More on that later.
Let's go through some options first.
Hit Edit...Preferences again. You'll see several items, including General, Tray, Cache, Archive, Browser, and Online Connections. Let's talk about each of these.
General: There are really only two things here that matter. Your username/password for Tradesight needs to be entered. The "Play Sound Notification with new feed entry" box, which is checked by default. This means that when there is an unread message in your Tradesight feeds, you get a sound. If you don't want the sound alerts, uncheck that and hit enter.
Tray: Several key options. "Send to tray on minimize" should always be checked. This means that if you hit the minimize button in the top right-ish corner of the Messenger, it will shrink the Messenger to an icon in your system tray. "Send to tray on close" is also checked. This means that if you hit the red X in the top right corner of the Messenger, it will also disappear and still keep running in the system tray. If you UNCHECK this and hit enter, then hitting the red X will close the program completely. "Send to tray on startup" is unchecked. If you check this and hit enter, then when you run the Messenger, it starts only in the System Tray. My suggestion is to leave all of these alone.
"Maximum number of news per notification popup." The default setting is 5. That means that if you have the Messenger shrunk down to the system tray, a little pop-up will appear when new messages are found, but it will only show up to 5. You can change the number. "Number of seconds to display a notification group" is the number of seconds that the pop-up window will last when new messages arrive. I actually use 10 on the first setting and 5 on the second, but the defaults are the opposite because not everyone uses/has many feeds. Make changes and hit OK.
Cache: Mostly ignore.
Archive: Mostly ignore.
Browser: The default is that everything opens inside the Messenger for you to see complete messages. If you still want to exit to a separate window, you can change this and hit Apply.
Online connections is for people behind Firewalls.
So those are the settings that you can change.
Now, beyond that, in the Messenger, you should see a list of Feeds. When you click on a Feed, you'll see the last "x" number of messages for that feed. Unlike the last Messenger, it separates things out by Feed. The messages themselves to the right include Date, Time, Title of Messenger, Feed, and soon, Author. If you click once on the message title to the right, you will see the Headline (i.e. the Trade Call or title) appear below. You will see a link underlined in blue below. Clicking on that will bring up the complete message in the Messenger. You can also double-click the Message up top.
Now, how do you set messages to update? Easy, but you have to do this manually the first time.
Right-click on each feed and hit Properties. Change the Update period to "Every Minute" unless you want it to check less often. Hit OK. Do this for each of the Tradesight feeds, and they will check for new messages each minute. Once they are set, you don't have to do this again when you run the Messenger again as long as you hit File...Exit once and then come back in. This saves the settings.
You'll notice that if you make the Messenger full screen, you can view complete reports in the Messenger itself instead of ever opening a separate web browser. The only issue is the recorded forex sessions, which we are working on how to cover.
Essentially, the Tradesight Messenger is what we call an RSS/Atom Reader. Therefore, we realized that we didn't need to stop at your secure Tradesight feeds.
So, we added a bunch of real-time news feeds.
These do not update by default. You have to turn them on. If you want to turn on none, some, or all of them, that is your choice. Here is a one-by-one description of the feeds in order.
Reuters Business News: Standard Stock stuff from Reuters.
Under CNN:
Economy: Separate articles about the economy and economic numbers
Fortune: Articles from Fortune magazine
Markets: CNN's market comments, about seven per day
Sivy on Stocks: A specific analyst's advice from CNN on certain stocks
Under Financial Times (one of the top global financial newsletters, and certainly a big one for finance):
Asia-Pacific: Headlines out of this region
Captial Markets: Headlines for global stock indices
Currencies: Headlines for currency and forex stuff
Equities: Headlines for global stocks
Europe: Headlines out of this region
Investors Notebook: Stock recommendations from their service
US: Headlines out of this region
Under PR Newswire:
Conference Call Announcements: News on earnings calls
Earnings Forecast: Changes in earnings projections
Investment Opinions: Trading ideas from them
Under The Street:
Mad Money Lightning Round: Links to Cramer's Mad Money Lightning Round in case you don't watch the show
Mad Money Recap: Links to Cramer's recaps in case you don't watch the show
Stop Trading: Links to Cramer's Stop Trading segment
Under Yahoo Feeds:
Bonds: A feed of information about the Bond market
Currencies: A feed of information about forex/currencies
Earnings: A feed of information about earnings releases
Economy and Government: A feed of information about economic data releases
Money Center Banks: A feed of information about banks
Upgrades/Downgrades: A feed of information about upgrades and downgrades
US Markets: A Yahoo feed of information about the US markets
So, you can activate any of these by right-clicking and hitting Properties. You can activate a group of Feeds under one title (like Financial Times) by right-clicking on the Financial Times item, hitting Properties, and changing the Update to "Every Minute" and checking "Adopt Recursively for all favorites." This will turn all of the feeds under Financial Times on to update every minute.
Note that the Financial feeds, several of which get new articles every minute, don't qualify for the sound alerts. Only Tradesight calls do.
In general, we fell that this Messenger provides a lot of information in a cleaner format where you can choose what you want and not have to wait for your IE or Firefox to open and get the complete message. Heck, you never even need to go to a website separately to view reports if you don't want to.
Enjoy, and I'm looking for any feedback so we can change things.
Rich Derrick's Intermarket Trading Webinar Series...
Rich's webinars have received terrific feedback over the years, and Rich has decided to do something a little different with his next topic. He's created a two-part seminar. The first piece is a fundamental overview of the topic that will give traders the broad picture, while the second piece gets into the technical action and will take place a month later.
Intermarket trading, or switching between asset classes, has seen strong growth in recent years and is expected to continue. In this new series, Rich will focus on intermarket cycles and trends. The emphasis of the work will focus on understanding the rhythm of market cycles and the global implications in the marketplace.
The first part of the webinar (Saturday, April 5, 11 am EST, $50) will focus on an in-depth introduction to intermarket concepts. This webinar is expected to last approximately an hour and a half, although Rich's webinars usually run a little long.
The second part of the webinar (tentatively set for Saturday, May 3, 11 am EST, $249, $199 for Platinum subscribers) will cover the technical analysis of intermarket cycles. This webinar is expected to last over three hours.
The topics covered in the first webinar include:
Intermarket correlations of stocks, bonds, curencies, and commodities
The business cycle and it's influence on different investment alternatives
Disinflation/Deflation--why Japan exported disinflation in the 1990's
The relationship between Commodities and USD: Important global implications for FOREX and stocks
Why Copper is the PhD of Commodities
How REIT's fit into the investment cycle
Global market influences
Anticipating when big money platers are likely to move money from one asset class to another
At Tradesight, we teach a top-down approach to trading markets, but we also teach that all markets can be traded equally, and in fact, that no single market is always the most interesting. Rich's webinar is a perfect topic for those that have always wondered when to concentrate on different markets. Even if your primary concern is one asset class, Rich will certainly help you recognize how to time the better moves in that arena based on a more macroeconomic view.
If you are currently a member, please e-mail kim@tradesight.com. Give her your username and tell her that you are interested in attending the initial event on April 5. If you are using your credit card on file, just send the 3-digit code on the back of the card along with your e-mail.
If you are not currently a Tradesight member, please e-mail kim@tradesight.com, and she will arrange for payment.
Instructions on how to get into the webinar will be e-mailed the day before the event, and we will record the webinar. Attendees can view the recording at any time in the future, as usual.
Details on how to sign up for the technical portion of the webinar will be available later in April.
2007 End of Year Recap of All Markets...
Every year, it comes down to this. Let's have a look back at the market, analyze what happened, talk about how trading was throughout the year, and discuss the macro-economic ramifications of it all on the markets. It's never a short report, so buckle up, maybe print it out, and let's get to work.
We will cover all markets here, but the main report of Tradesight remains the stock market, and from a macroeconomic perspective, there is much to discuss here. Forex stuff will be covered later in the report.
As a reminder, if you read last year's end of year report (click here); INSERT INTO `wp_posts` (`ID`, `post_author`, `post_date`, `post_date_gmt`, `post_content`, `post_title`, `post_category`, `post_excerpt`, `post_status`, `comment_status`, `ping_status`, `post_password`, `post_name`, `to_ping`, `pinged`, `post_modified`, `post_modified_gmt`, `post_content_filtered`, `post_parent`, `guid`, `menu_order`, `post_type`, `post_mime_type`, `comment_count`) VALUES we talked about the VIX and how disappointing it was that the Volatility Index remained in the low teens for so long, something which general means that market action and range is limited. Also, NASDAQ volume plays a key role. So before we head into the index charts, let's start with a look at how those were in 2007.
In 2005, NASDAQ volume averaged well under 2 billion shares a day, which makes for tough trading. In 2006, it averaged around 2 billion shares a day, which was good. Here is a look at 2007 NASDAQ volume day by day, with the 2 billion share line drawn:
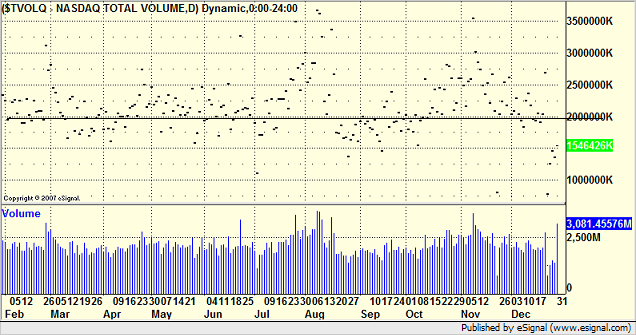
You can see that the majority of days were over 2 billion shares. In fact, if you ignore a few of the very low ones (holidays); INSERT INTO `wp_posts` (`ID`, `post_author`, `post_date`, `post_date_gmt`, `post_content`, `post_title`, `post_category`, `post_excerpt`, `post_status`, `comment_status`, `ping_status`, `post_password`, `post_name`, `to_ping`, `pinged`, `post_modified`, `post_modified_gmt`, `post_content_filtered`, `post_parent`, `guid`, `menu_order`, `post_type`, `post_mime_type`, `comment_count`) VALUES over 80% of the year saw better than 2 billion NASDAQ shares. That’s a great number for trading purposes. Now, here’s the VIX:

Much different story than 2006. The VIX not only came out of the low teens early in the year, but it held up above 20 for most of the second half of the year, including a spike near 40. Remember that back in the 1990s, a spike to 40 on the VIX usually represented a bottom in the market in the short-term. This is a panic scenario where most of the bulls have thrown in the towel. So where did the spike to 40, which was in August, occur versus the NDX? Here’s the NDX for the year:
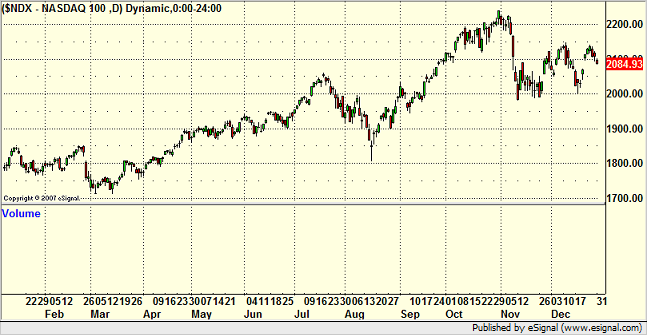
You can plainly see that the market rolled in July and the NDX went from 2050 to 1800 in a few weeks, which was a 10% drop. The low day was the place that the VIX almost hit 40. Unlike the last five years, I think the VIX is showing that it has meaning again. It also is showing us that intraday volatility is better than it has been. We’ll get to what that meant for us in a bit.
Since I just put up the NDX, let’s talk about it. It started the year at 1756 and closed at 2084. So, the tech-heavy NASDAQ gained 328 points, or 18.6%. There was obviously a lot of good volatility, up and down movements, and we already discussed the great volume.
In general, this means that it was a good trading year for us, particularly once again for our intraday trading that we do in the Trading Lab each day. We profited constantly from stocks like AAPL (our daily bread and butter); INSERT INTO `wp_posts` (`ID`, `post_author`, `post_date`, `post_date_gmt`, `post_content`, `post_title`, `post_category`, `post_excerpt`, `post_status`, `comment_status`, `ping_status`, `post_password`, `post_name`, `to_ping`, `pinged`, `post_modified`, `post_modified_gmt`, `post_content_filtered`, `post_parent`, `guid`, `menu_order`, `post_type`, `post_mime_type`, `comment_count`) VALUES RIMM, and GOOG. AAPL spent the second half of the year with more than 4 points of range each day on average, and AAPL is such a consistently technical trader, it’s hard not to make money. Looking back on my stock profits for the year, over 35% of them came in AAPL alone, and if I had a way to really check, I would bet than most of those gains were in the first two hours of the trading day. Just something to keep in mind.
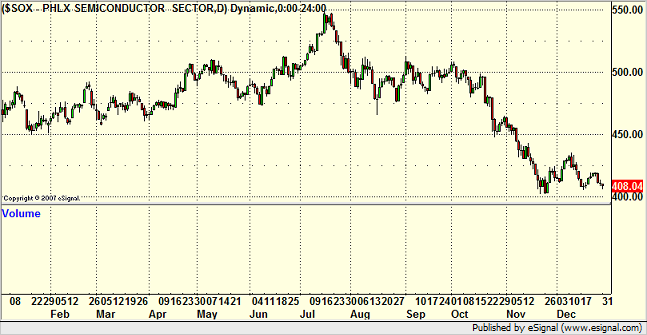
One thing that makes the NDX move interesting is taking a look at the two key sectors that generally benefit the NASDAQ the most. The SOX was actually down sharply for the year, especially late in the year:
And the BTK was rangebound at best:
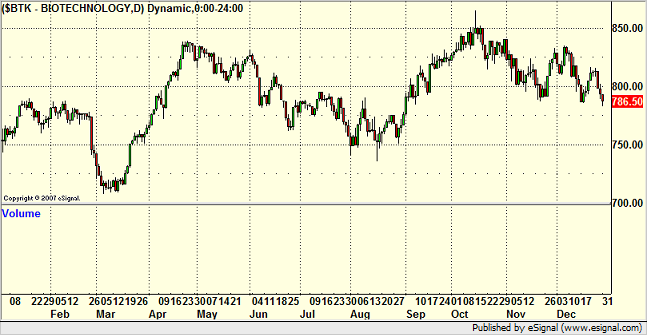
I think when you see those charts, you have to recognize the role that AAPL:

GOOG:
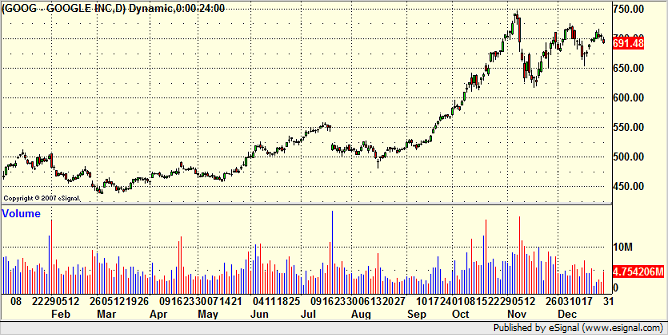
And RIMM:
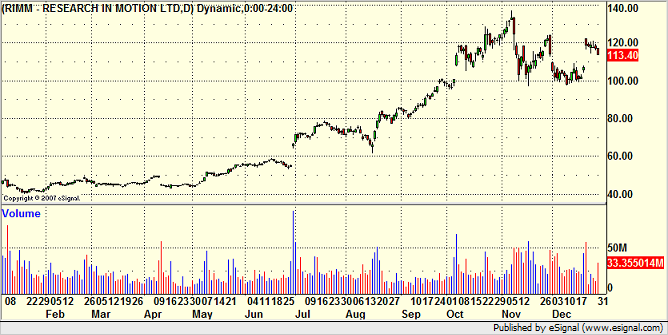
Played in the NDX move by themselves. I think once again, this puts these particular stocks in a place where they are open to selling as we head into 2008. The gains that they posted by September and October led to a situation where people were unwilling to sell them late in the year and lock in capital gains for 2007. I would start by watching AAPL’s earnings, which are due in just over a week, and expect a decline following the earnings, if not sooner. The one thing that could boost the stocks from here would be a split announcement.
So the SOX and BTK suggest that maybe, despite the volatility and volume, the NDX chart is not representative of a broad gain in the markets for the year. Was it an ideal year for swing trading (holding positions for several days in a row)? If you look at the NDX chart, it looks like it could have been. But the SOX and BTK don’t look so interesting. How about the biggest, broadest index of them all, the S&P 500? Here it is:

For the year, it started at 1418 and closed at 1468. This is a 3.5% gain in the broad market. The high to low range was just over 150 points, and 80% of the year was spent in a 100 point range between the two lines. This is opposed to the prior year, where the S&P had 220 points of range and a 13.4% gain from start to finish.
In other words, the broad market this year was unexciting and contained. INTRADAY TRADING ACTION was back to the way that we like it. This makes the calls in the Trading Lab much more valuable than the calls in the reports on average. There were very few days that we couldn’t find something to do in the room with our main trading stocks, but daily chart pattern setups were less useful than in the prior year because the market never really got legs overall.
Another interesting note about the year is the bond market, which had turned down earlier in the year (rates on the rise) and has since reversed and closed at highs (rates at lows); INSERT INTO `wp_posts` (`ID`, `post_author`, `post_date`, `post_date_gmt`, `post_content`, `post_title`, `post_category`, `post_excerpt`, `post_status`, `comment_status`, `ping_status`, `post_password`, `post_name`, `to_ping`, `pinged`, `post_modified`, `post_modified_gmt`, `post_content_filtered`, `post_parent`, `guid`, `menu_order`, `post_type`, `post_mime_type`, `comment_count`) VALUES presumably due to the flooding of liquidity by the Fed to offset the mortgage concerns. Here’s the Bonds:
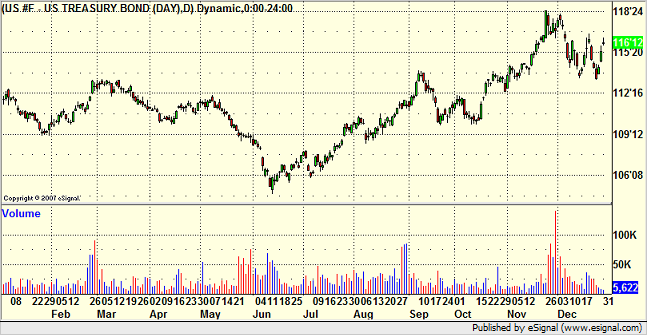
That is the biggest surprise of the year to me, as I expected rates to rise throughout the year. But, I wasn’t anticipating the record interventions by the Fed.
So from a stock trading perspective, I think that you look back at your results and should expect to find that the intraday trading results were much better than anything that was longer term.
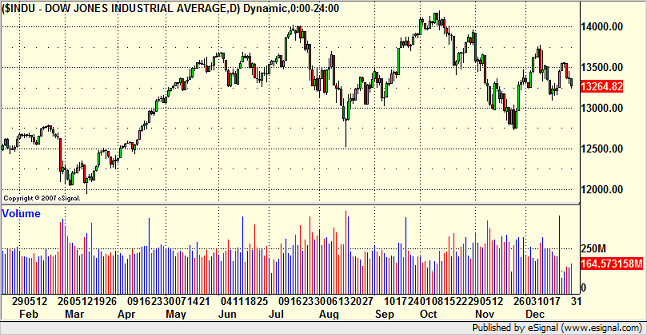
I'm not a big fan of the Dow Jones Industrial Average, but I'll put it up here just to have it:
Two other comments related to stocks. One of my favorite sectors of the market to trade is the small cap sector. We’ve had some enormous years in this arena. When this sector is working, there’s nothing like finding stock after stock breaking out of great patterns and running from $5 to $6 in a day or two. It adds up quickly. However, here is the Russell 2000, which is the main index for the sector:
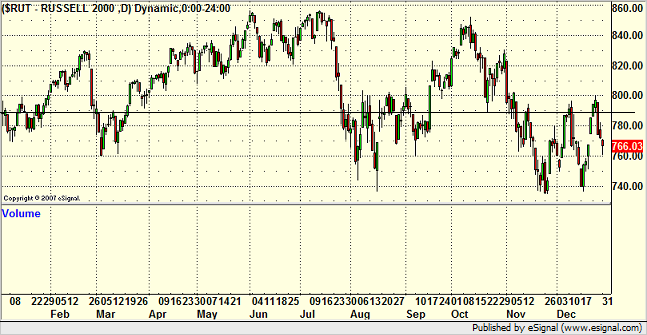
A very disappointing year for the Russell, and easily the worst year for the small cap stocks in the last six. It closed red for the year, but it never really had any significant runs. The best period was September and early October.
The other comment is about the report that generated probably the highest percentage of winners this year, which was the ETF report. This is more of a swing trading-based report, which means the calls are designed to play out over several days and basically just plays the indices. The QQQQ strangle calls in that report, which are made monthly, did very well this year, with only two complete losses and three plays that doubled or better. Overall, between 75 and 80 percent of the ETF calls worked. The other bonus of the ETF calls is that many are “pieced into,†which means that you start with small size and add as the trade works on a broader scale. That means that even if you do get stopped out on the initial trade, the loss should be tiny. The whole year is not about the ETF service as light volume and flat periods make it tough, but there was plenty of great opportunities at various times.
Was there anything this year that just plain doubled? Yep. Oil. Straight run from about $50 to about $100. Yuck:

The connecting point between the stock market and the forex market to me is the US Dollar Index. Here is a look at the year in that index:
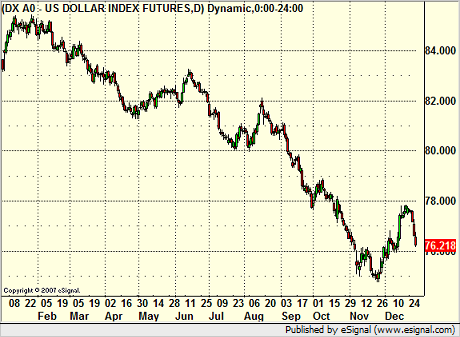
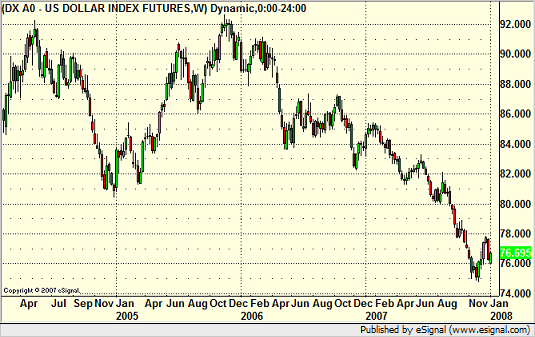
Now, to compare this to 2006, the US Dollar Index spent most of the year in a 4-5 point range. The range here was over 10 points, and after about April, things really started to move. This gives us a clue about how the forex market was to trade for the year, but we’ll talk about that in a minute. Let’s look at the Dollar Index in weekly form going back further so you can see how much more range there was here, especially in the second half of the year, versus something like 2006. 2005 and 2004 were good years, but I think we will look back at 2006, especially the second half of that year, and view it as one of the most extended doldrum periods in the forex markets:
And here is a look at the US Dollar Index over the last decade, which is interesting:
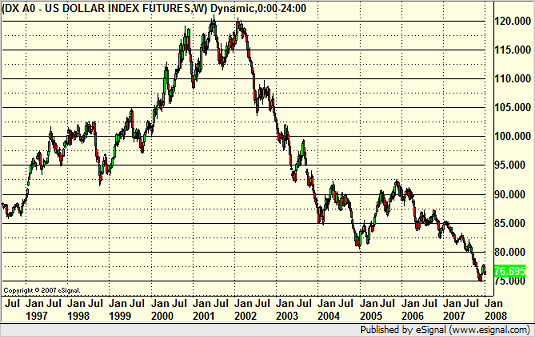
I think that the more important macro view, and I’ve said this in the past, is to look at all of the data on the US Dollar Index, going back to 1985. Here is that monthly data:
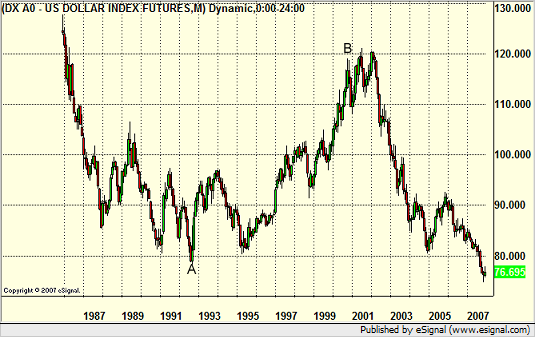
I’ve marked two points on that chart, and I think they are significant. The chart begins on a serious decline and bottoms out at A. Point A represents the switch in our government policy from deficit-spending to balancing the budget, which occurred throughout the 1990s under Clinton (point A actually marks, to the day, his election). Point B represents the switch back to deficit spending via tax cuts and increased Federal budgets (the change occurs in a policy shift marked, obviously, by the election of the current President). Pretty hard not to see the connection and the impact on the Dollar. I bring this up because we are entering an election year here in the US, and the outcome of that election will have an impact on the US Dollar more than anything else. This could lead to a significant change in direction on the US Dollar Index, and we will be monitoring this heavily.
Having said that, the forex markets ended 2006 in one of the longest, slowest periods that I’ve seen. I am a firm believer in the idea that markets cycle and that there are slow periods in any market, probably several lulls in a year. The basis of my trading system in the forex markets is not to try too hard to force winning trades during the lulls, as it is virtually impossible to pull winners out of a market that isn’t moving consistently. The general concept of the system is that the market tends to go through 2 or 3 lulls lasting 4-6 weeks each year, and you just ride those out and keep your losses limited. 2006, however, brought us almost 6 months in a row of a slow period that really didn’t start to come to an end until early 2007, as mentioned above. The rest of the year, however, saw very little in the way of slowdowns. Ranges, which had dipped remarkably in the second half of 2006, came back strong. We now have computed average daily ranges for the major pairs, and some of them have shifted a bit since last year. Here are the numbers we will be using as averages in 2008.
EURUSD = 115 pips
USDJPY = 90 pips
GBPUSD = 145 pips
GBPJPY = 190 pips
USDCHF = 110 pips (significantly lower)
AUDUSD = 90 pips
NZDUSD = 85 pips
USDCAD = 80 pips
GBPCHF = 145 pips
EURJPY = 165 pips
Before we dig into some of the individual pairs, I wanted to comment on two things. First of all, August, which is typically a slow month in all markets, including forex, was exceptionally big this year. Easily the best month of the year in forex. Just goes to show you that you just never know when the good periods will be. Also, the daily chart of the US Dollar Index is particularly useful to watch from the perspective of a Demark count. Here is the index again this year with the 9-bar counts, and notice how many times the high or low occurs on the ninth bar:
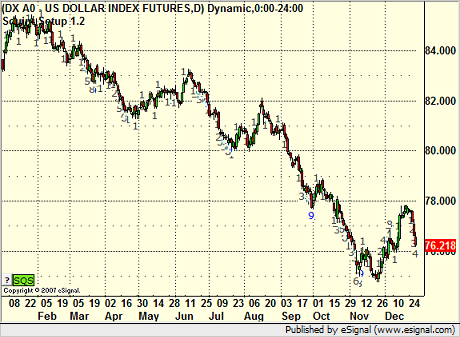
So, let’s dig into the pairs. Once again, the GBPUSD was the best trading pair, with good average range and lots of overall movement:
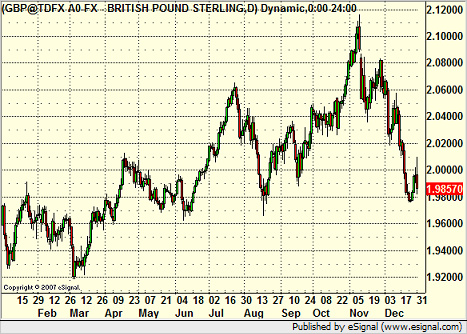
The high to low range for the year was 2000 pips, which is terrific.
Here is a broader perspective on the GBPUSD, the weekly chart going back much further:
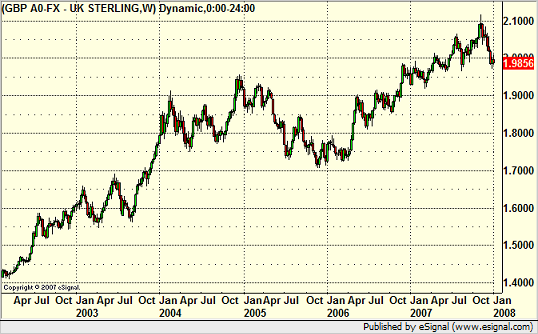
Not much else to say here except the trend continues.
The EURUSD had a very directional year overall:
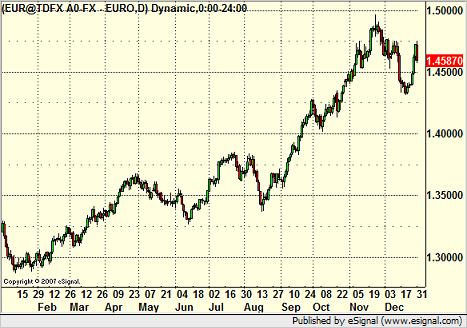
The range here was again 2000 pips, but it occurred with several back and forth moves. As a reminder, the prior year’s range on the EURUSD was 1200 pips, but over six months found the pair stuck in a 400 pip range. This is SIGNIFICANTLY better from a trading perspective.
The USDCAD closed out the year near par after dipping to a level where the Canadian Dollar was worth more than the US Dollar:
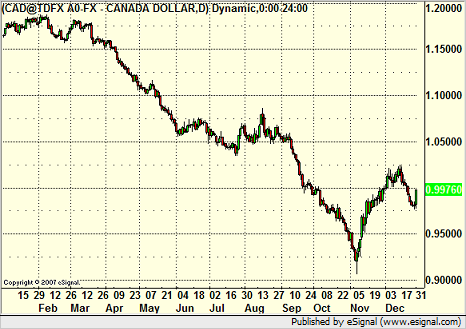
The AUDUSD actually had some great movement in the second half of the year, along with great daily ranges, which makes it very interesting because it is cheap to trade:
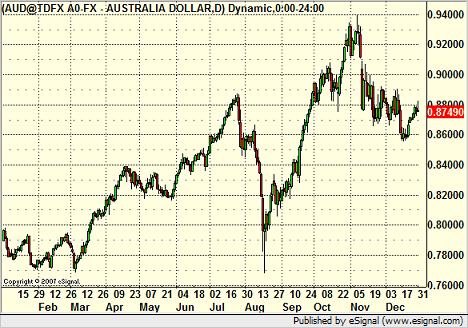
Not much overall excitement in the USDJPY:
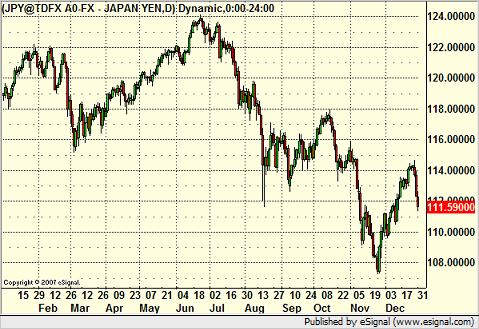
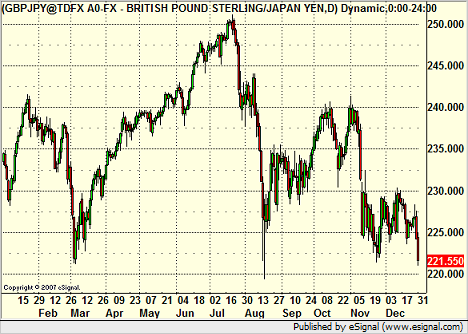
The GBPJPY, which had been a favorite for a long time because of the so-called “carry trade,†came back sharply this year with lots of wild movement. This is a head and shoulders formation overall, which could lead to an ugly downside move if it breaks:
So that was the year. The last six months were great for forex, the whole year saw great trading volume and good volatility reading for stocks, but a lot of that is deceptive because the broad market went nowhere, the traditional tech sectors like the SOX dropped, and the small caps had their narrowest year of the last decade. As I always say, markets cycle, and the reason that I trade everything is because I want to be able to move to where the action is. Fortunately, there was plenty to be found in 2007.
What are the keys to 2008? With all of the talk of recession and the credit crunch that is occurring right now, I would expect some volatility. Most important, I think stock players need to be ready to play the short side a little more than they were forced to in 2007. I’m looking for better range out of the S&P. For the forex markets, there will definitely be continued volatility due to the credit crunch, but the second half of the year, especially August and beyond, is an unknown. All eyes will be on the US elections, and unless there is a clear leader between the parties in advance, the currency market will probably slow down a bit, waiting for an outcome. I would also prepare for the possibility of a 3-way race this time, and that might create even more uncertainty for the currencies late in the game after the summer conventions.
Either way, we look forward to 2008. Thanks for being the best subscribers in the world.
FX Ticker Soft Launch and Process...
Hi all-
I just received a call from FX Ticker today outlining the launch process for the site, which is about two weeks behind the original plan. That's not exactly bad considering how technology works, but it has forced them to roll this out a little differently than they originally wanted. We didn't get to test out our part of the site as much as I would have liked prior to the launch, which is why they are calling it a "soft launch." They aren't going to be advertising it much initially while everyone involved gets used to working on the site. As much as it seems like a simple site, there are really a lot of pieces behind the scenes. I wouldn't want to be their admin guy.
What they wanted in place before they put the site up was all of the pieces of their news and premium services. As I said, I was hoping to get a little more practice before they made it publicly available, but they have just gotten the final pieces of their news situation put together. Essentially, their asking us to view it as a "beta-site" for about a month, meaning we're all going to get used to posting there and stuff like that.
First, a few people have asked me "Why are you allowing the Tradesight Forex service to go down to $25?" It isn't as simple as that. Mark and I are essentially being "contracted" by FX Ticker to post exclusive content on the site in terms of explanations of trades and general market commentary. So instead of just looking at the service in terms of a subscription product for us, we're now looking at it as a much cheaper service that could therefore interest many more people that we will be exposed to through FX Ticker at a lower price point, plus a contract to put stuff on their site and keep an on-going discussion of the forex markets. I will say that this step is the first in a process that will hopefully lead to 24-hour (or at least 16-hour) coverage of the forex markets from a Tradesight perspective. I'll leave it at that for now. Obviously, we wouldn't just drop the price 83.2% (from our end, you need their $29.95 premium service too) for no reason. The plan is to provide the Levels in many pairs and cover the markets in terms of how the pairs are playing out against the Levels from the Asian market, through the European session, and into the North American session. We might even do it in multiple languages.
OK, so back to the launch. We're asking for everyone's patience on this because it is a complex beast. It looks like by Friday late in the day, they will put the site up at www.fxticker.com. The site will include the following:
1) Global Economic Calendar
2) A few streaming-but-delayed free news headlines that relate to the forex markets
3) Multi-topic bulletin board to discuss forex platforms, forex trading, etc.
4) There will be a lot of on-line free seminar from industry professionals of all sorts
5) Polls
6) Free market educational commentary
And the Premium service.
What you'll do is this. Once the site is up, register yourself with the site. Pick a username and password (doesn't have anything to do with Tradesight, so don't worry about making them the same). After that, you'll see a box on the home page when you are logged in that offers the Premium Service. Click on that, go through the shopping cart, and make the Premium purchase for $29.95. I actually referred them to our billing company because they were having problems with the software from another company, so the shopping cart process should look familiar to most of you.
Once you have the Premium subscription taken care of, you'll get three things.
1) Access to the Premium tab on the website at FX Ticker when you are logged in.
2) A coupon code for Tradesight Forex via e-mail.
3) Permission to use their really cool news tool.
Now, the delay this month from what I understand had to do with the news tool itself, and so what you'll get for the first month or so will be a little different than what they ultimately will get you later in March. Basically, for now, once you are a Premium subscriber, if you go to the Premium tab on the site, you will get real-time economic and forex only news scrolling on the page (like you would see at Briefing.com) . This news feed is supposed to be great, and they are tweaking it over the next two months to get better. They don't want earnings and stock market information. Just the type of stuff that forex traders would care about, delivered instantaneously. I'm hearing economic data headlines will hit even faster than Briefing, especially once the full pop-up tool is available in a month. If you have Briefing but mostly use it for economic data and not for news throughout the day, this will replace that.
In about a month, they will give you a download link to install a tool that will show in your system tray. Instead of waiting for a web site to refresh, this tool will delivery these forex-specific headlines in a pop-up manner (like an Instant Message program) straight to the lower-right corner of your desktop. If you click on the headline, it goes to the full story, but for many people, the fast headlines will be enough, and the beauty is that you don't have to sit on a webpage to get them. It's pretty neat stuff. In my opinion, it's useful for people trading ANY markets that want quick economic headlines.
Once that pop-up tool is delivered, then the Premium tab on the website will be a page for deeper market projections and analysis that is somewhat forward-thinking from both Tradesight and AimeFX (some of you met Clay in the Chat room last week).
So the site will have two tabs for forex commentary. The regular, non-Premium market tab will just be for review commentary (i.e. "US Dollar is stronger, really working best against the CHF" or "Here's an example of a Demark bounce off of a Break level" with the chart). The Premium tab will have stuff like our beginning of the week overview of the US Dollar index, etc.
If you are an existing subscriber, once you have the Tradesight code from FX Ticker, e-mail it to kim@tradesight.com and we will make adjustments to your account over here. It may take a few days, but we consider that you should have the $25 rate effective whenever you get us the code for your existing account, and we will prorate and credit the difference shortly as we said in prior messages. If you are not a Tradesight subscriber and have been waiting for the FX Ticker launch to sign up with us, then you should be able to take that code, go to www.tradesight.com, hit Subscribe Now, and use that code in the shopping cart so that you will be billed $25 instead of $149 for the service. Again, if you sign up this weekend and something goes wrong with the billing (i.e. it charges you $149 instead of $25); INSERT INTO `wp_posts` (`ID`, `post_author`, `post_date`, `post_date_gmt`, `post_content`, `post_title`, `post_category`, `post_excerpt`, `post_status`, `comment_status`, `ping_status`, `post_password`, `post_name`, `to_ping`, `pinged`, `post_modified`, `post_modified_gmt`, `post_content_filtered`, `post_parent`, `guid`, `menu_order`, `post_type`, `post_mime_type`, `comment_count`) VALUES we will obviously fix it. We thank you in advance for your patience in helping us work through this.
To be clear, if you are a forex-only customer or forex is part of your regular subscription and you are charged $149 for the service on March 1 and then get the code to us March 3, you will be credited back about $115 proration for the rest of the month of March, as we said before. We simply cannot start the new pricing under contract until FX Ticker "launches" and makes the premium service available.
Final note. This has gone out before, but I just want to remind everyone. Our new pricing is 100% effective the day that FX Ticker "soft launches," so I wanted to run everyone through the pricing once again as forex is now 100% on it's own and not in the platinum package.
Here we go:
Forex service $149 ($25 with FX Ticker coupon as long as you continue to subscribe to FX Ticker Premium)
That's separate and then:
Stock service $199
Small Cap $50 as add-on to stocks or $75 by itself
ETF $50
Futures Levels $50
English Chat/Trading Room $59
Those services without Forex add up to $408. If you take them all, you get a discounted "Platinum package" price of $379.
To be clear, obviously the bulk of the discount here relates to the forex service itself. Platinum subscribers were already receiving a deep discount at $460 versus about $550 for each of the services individually before. So someone that is just taking Forex goes from paying $149 to paying $55 (including the cost of the FX Ticker Premium and the news tool). That same discount applies to someone that had two services, let's say forex and futures. Someone that had the Platinum Package goes from $460 to about $430 (with FX Ticker Premium). The savings are less because the discount was already in place and the other services are not being discounted more. But, it is less money and you do get the news tool as well. And then again, many of you will be able to cancel Briefing.com with this.
So, hope that clears everything up, and I hope you enjoy FX Ticker. I saw the site late last week and it looks very clean. I do plan to make it my stop for an Economic Calendar and news, and Mark and I look forward to contributing to the total site with content. Please be patient with the process as we have a lot of people to get adjusted in our billing system. Just know that Tradesight's new pricing goes into effect as soon as FX Ticker puts their site up, and we will make your Forex service adjust to the new $25 price effective whichever date you give us the coupon.
Good trading, and thanks for being the best subscribers in the world.
Chris Mercer
President
Tradesight.com
Tradesight ETF Report: Spotlight Play of the Week...
Tradesight is pleased to announce that our ETF report will now include a "Spotlight Play of the Week." This call, given somewhere between Monday and Wednesday typically, will be denoted in the Messenger with SPotW in the title.
The ETF report and service is designed for less active traders who want to take a broader approach to the markets via the indices, which are typically less volatile than stocks themselves. It is simply a matter of placing stop entry trades and then raising your stop loss while waiting for the ETF to head toward various targets. The ETF calls are not typically designed as something that needs to be monitored on a moment-by-moment basis. Rich and I have been working on several ETF-specific setups that we think are going to be very useful for those that want to take a wider approach to the indices. For example, this last week, you may have seen a couple of key Value Area calls on the SPY that worked. In addition, Rich has been honing a set of indicators that combine for a certain type of entry.
Obviously, we can't predict which of these types of plays will set up each week, but we do expect to find at least one in the first half of the week. So, using calls like that, we will make one Spotlight call each week. This is a call that we believe is as well set up as it can be. There will be an entry and stop established clearly up front. We believe that these calls are as high-probability as we can find in the market. The goal of these calls is to give everyone a very specific play to focus on, as the ETF calls can vary greatly in setup. They could take more than one day to play out, but we want them closed by the weekend, which is why the entry/setup will be called between Monday and Wednesday.
All ETF calls are now being made in the Messenger throughout the session (and before the open). The Sunday reports are used to analyze the market and review the calls that triggered during the prior week.
Our feeling is that the Spotlight call each week will be something that by itself makes the ETF service worth your time and money.
Sincerely,
Chris Mercer
President
Tradesight.com
