Markets are about reality, and what I mean is that you have to accept certain things about market behavior. For example, options expiration plays a key role during the week of expiration and on expiration Friday itself. To ignore that is to ignore key information that can help you trade better.
Another key reality is that the end and beginning of quarters tend to have certain characteristics for stocks and the indices. Essentially, the idea is that we commonly see the market go flat for the last couple of days of a quarter as the major funds have their positions placed and the market is largely sitting where they want it to for the end of quarter statements for clients. What is also important here is to realize that after the quarter does end, things start to pick up to make up for the fact that the market was artificially contained. Here’s an example of how this can look, and there is no magic formula for whether it will be one day or three days or five days.
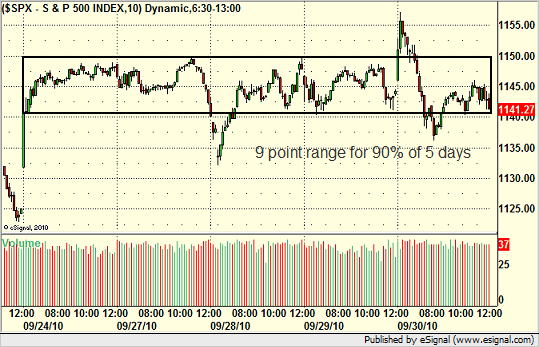
This time, it was five days. Here’s the S&P 500 showing trading from last Friday through the end of this Thursday, which was the last day of September and Q3:

Basically, 90% of that week was in an impossibly narrow 9 point S&P range. We had a spike down Tuesday that returned to the main range and a spike up Thursday that did the same (both gave us nice opportunities, include several big stock winners on the gap down Tuesday and almost a 20 point winner on the NQ futures contract on the gap up Thursday.
This is not normal market behavior. You would be hard-pressed to find something similar that wasn’t either a significant holiday week or an end of quarter. The fact that this went a full five days is pretty amazing. It wasn’t apparent after Friday, the first day, and Monday was a disappointment, but after Tuesday, you had to see the rest coming.
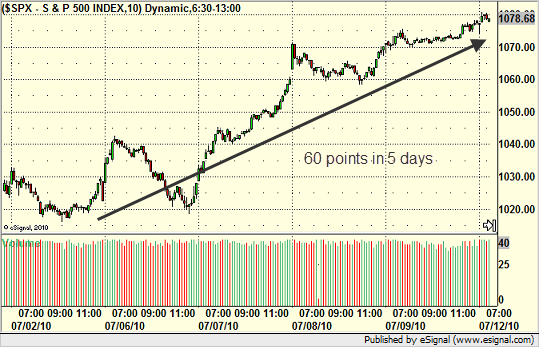
Meanwhile, let’s look at how Q3 started back at the beginning of July. Note that the Fourth of July holiday was right at the start, so really the move starts after everyone gets back.

That’s a nice move and was very easy to make money in. 60 points in about 5 days.
So these things happen, but they don’t tend to happen at random times. The first days of a quarter are commonly good periods of movement (doesn’t have to be the very first day, but usually pretty quick). The end of the quarter can be slow, whether it be just a day or two or more. You need to understand that and factor that into your trading. I had a successful week because I saw this early and adjusting my trading accordingly. I focused on the opening 90 minutes and did well on the two days with the gaps, but was fairly picky beyond that.
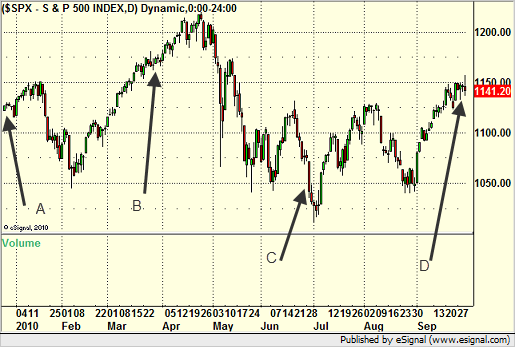
Let’s look at the end/beginning of the last four quarters on a daily chart of the S&P:

Point A is the end of 2009/start of 2010. The last week of the year is almost always slow with so many traders away and most people having done their buying and selling for tax purposes in advance. Meanwhile, note that we did start moving once January hit. That one isn’t rocket science as there are several factors going on.
Point B is the end of Q1/start of Q2. See how we went flat for a couple of days at the end of the quarter (almost a week); INSERT INTO `wp_posts` (`ID`, `post_author`, `post_date`, `post_date_gmt`, `post_content`, `post_title`, `post_category`, `post_excerpt`, `post_status`, `comment_status`, `ping_status`, `post_password`, `post_name`, `to_ping`, `pinged`, `post_modified`, `post_modified_gmt`, `post_content_filtered`, `post_parent`, `guid`, `menu_order`, `post_type`, `post_mime_type`, `comment_count`) VALUES then ran when the quarter started?
Point C is the end of Q2/start of Q3. The end of Q2 was the exception, as the market was still moving around wildly until the last day of the quarter. But, as I already showed, we did move…up…sharply once the next quarter started.
Point D is now. We just suffered through five horrible days and came out unscathed. This next week is a good time to concentrate.
