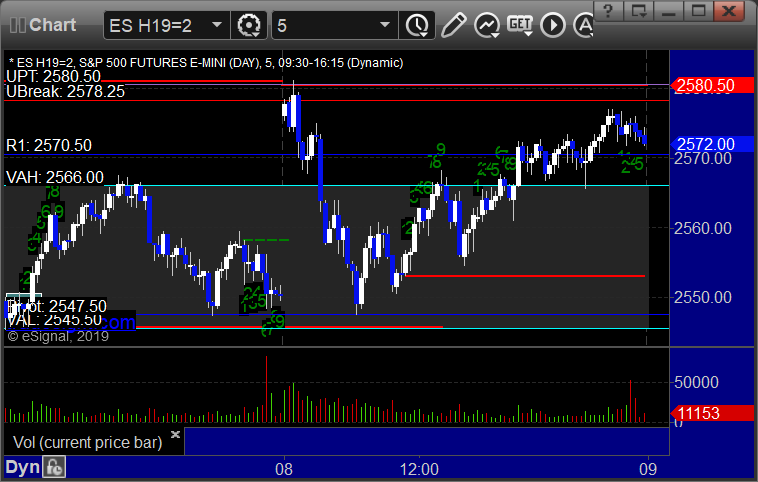
The markets gapped up,
filled in the first two hours, then slowly made their way back up to
where they opened on 2.4 billion NASDAQ shares.
Net ticks: -14.5 ticks.
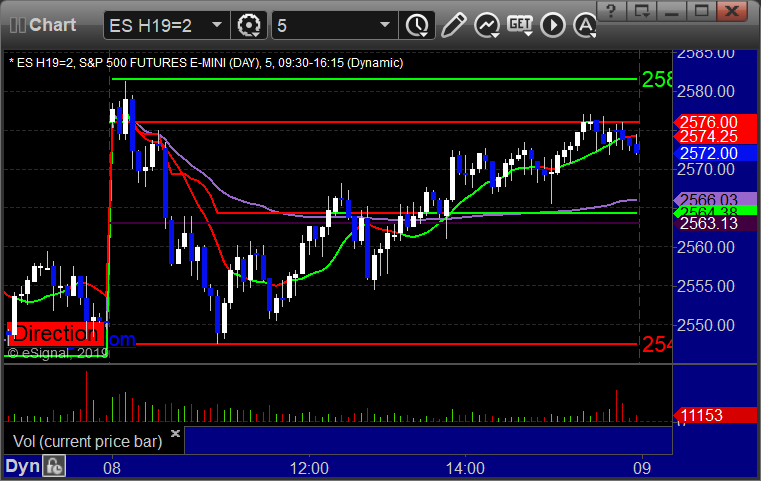
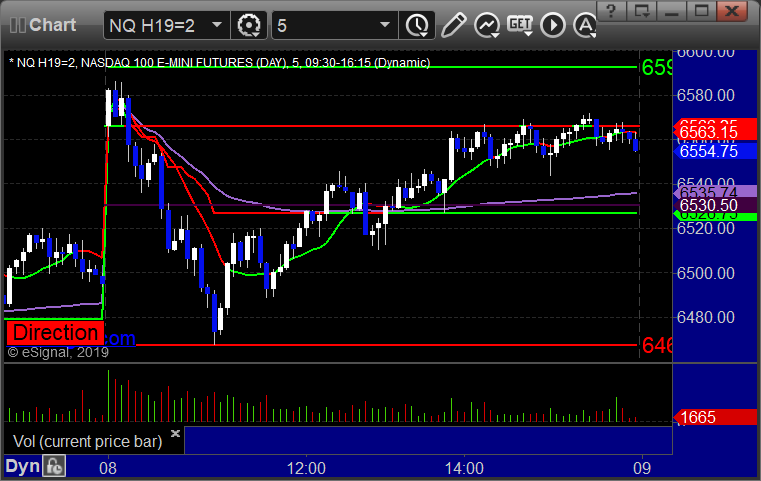
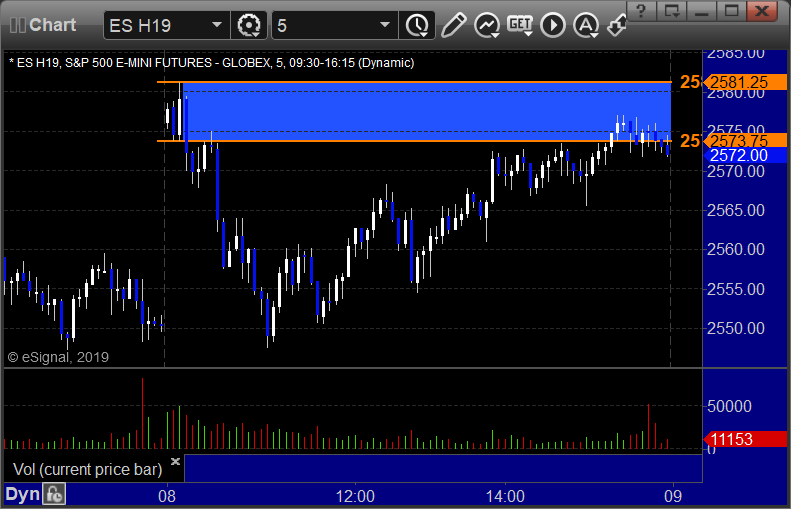
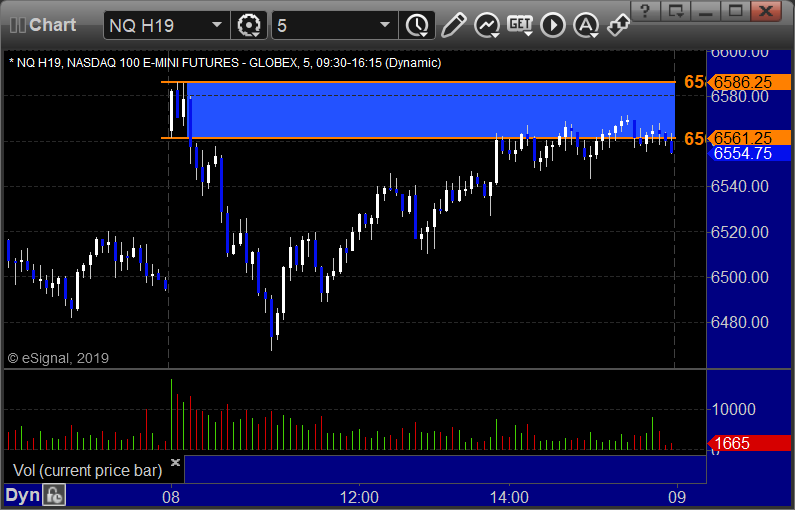
As usual, let’s start by taking a look at the ES and NQ with our
market directional lines, VWAP, and Comber on the 5-minute chart from
today’s session:
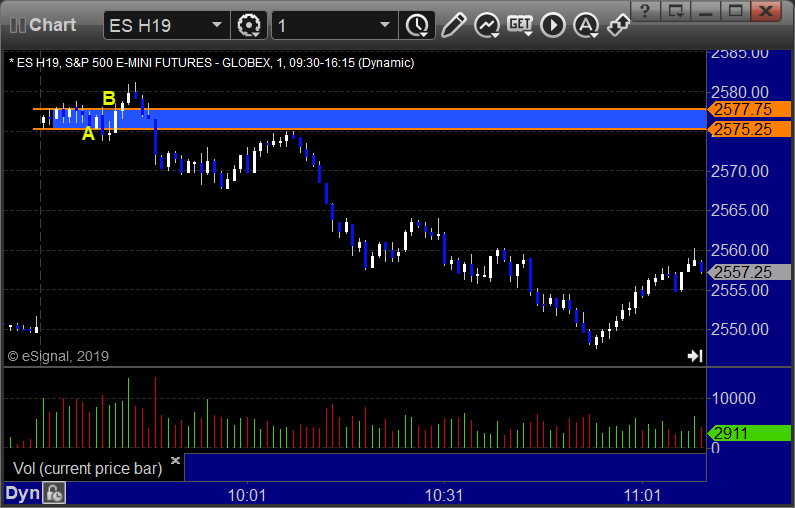
ES and NQ Opening and Institutional Range Plays:
ES Opening Range Play triggered short at A and didn’t work, triggered long at B and didn’t work:
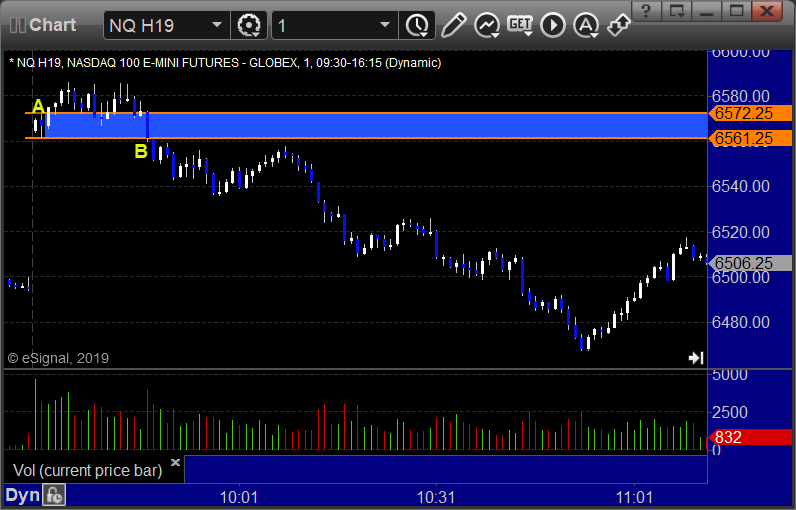
NQ Opening Range Play triggered long at A and worked enough for a
partial, triggered short at B but too far out of range to take:
ES Tradesight Institutional Range Play:
NQ Tradesight Institutional Range Play:
ES: