The markets gapped down, came back up a bit, never filled the gap, and closed red on 1.9 billion NASDAQ shares, likely due to the weather across the country.
Net ticks: +4 ticks.
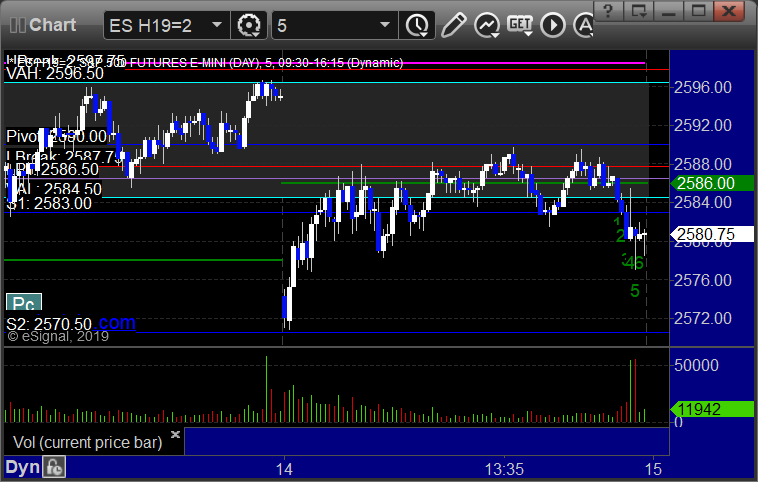
As usual, let’s start by taking a look at the ES and NQ with our market directional lines, VWAP, and Comber on the 5-minute chart from today’s session:
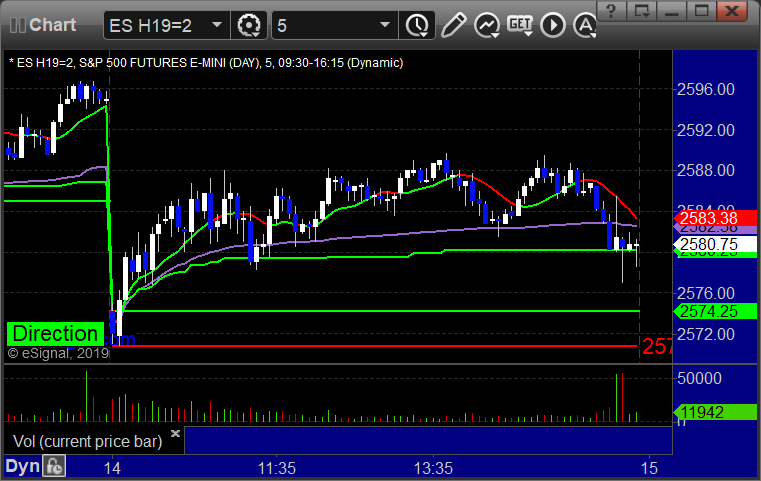
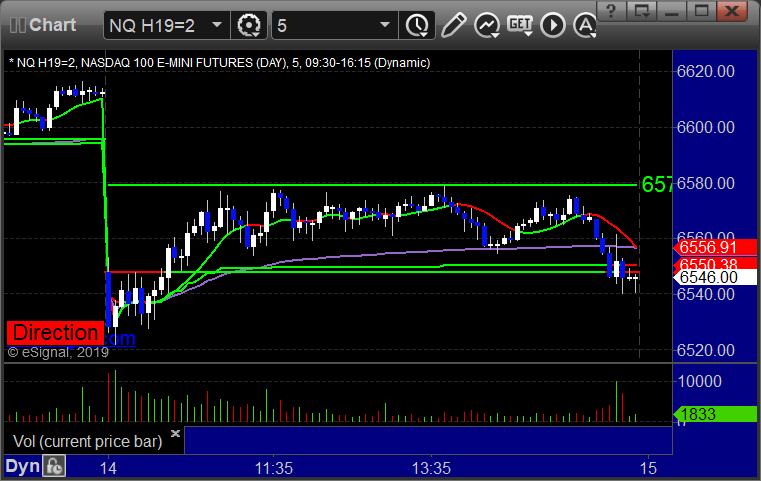
ES and NQ Opening and Institutional Range Plays:
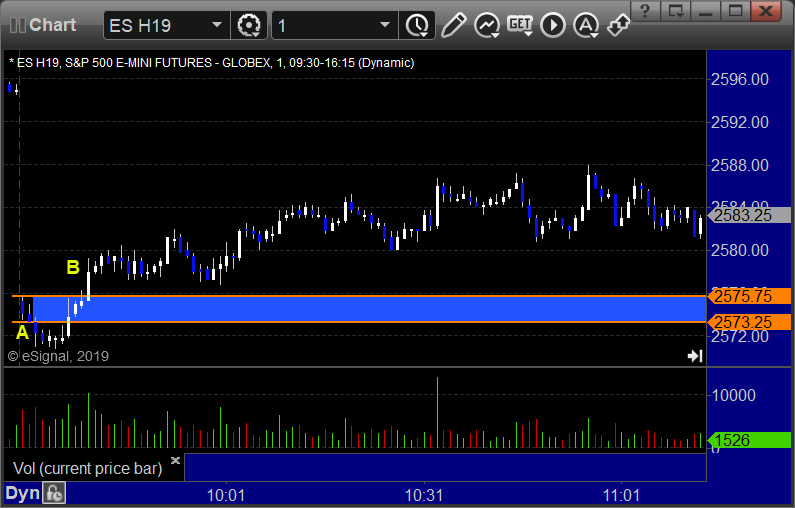
ES Opening Range Play triggered short at A and stopped, triggered long at B and worked enough for a partial:
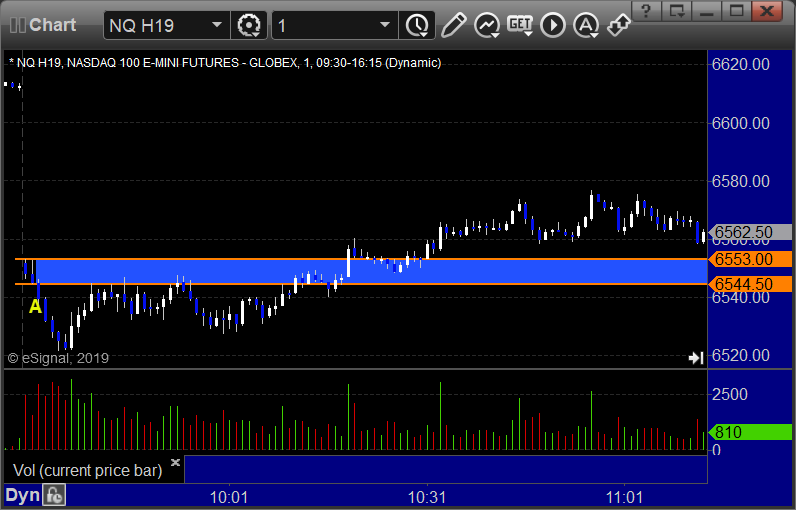
NQ Opening Range Play triggered short at A and worked:
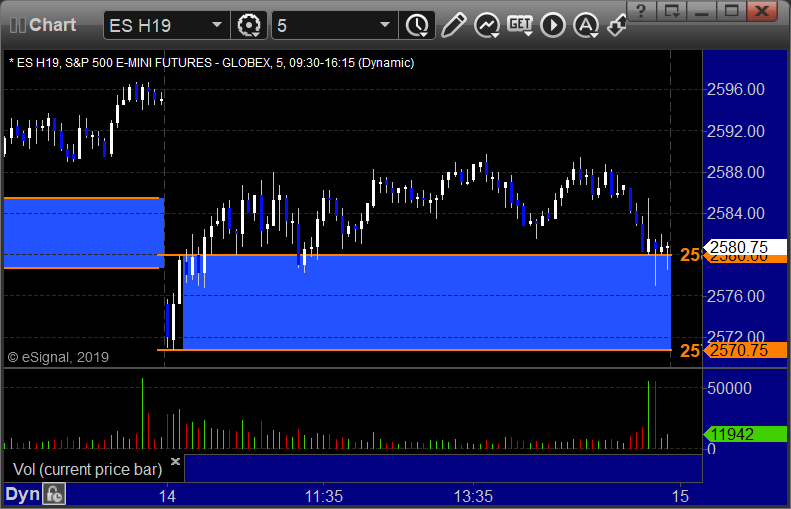
ES Tradesight Institutional Range Play:
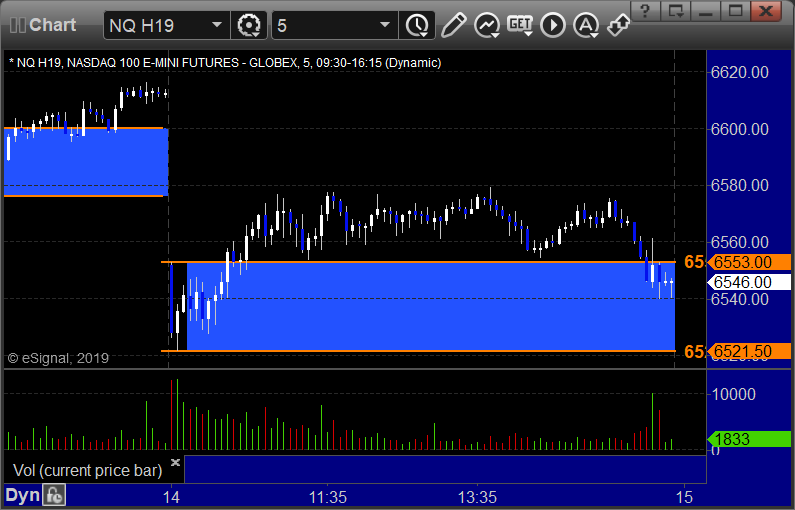
NQ Tradesight Institutional Range Play:
ES: