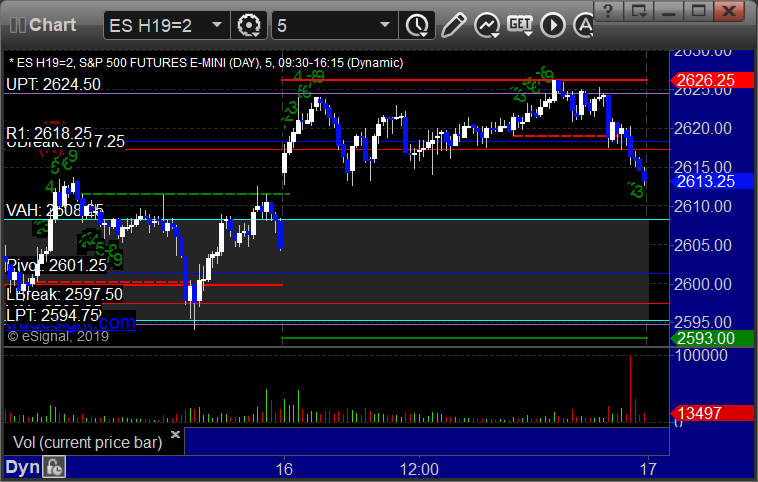
The markets gapped up,
tried to go higher, eventually filled, then went pretty flat for the
session on 2.1 billion NASDAQ shares. No real signs of options
unraveling.
Net ticks: +11.5 ticks.
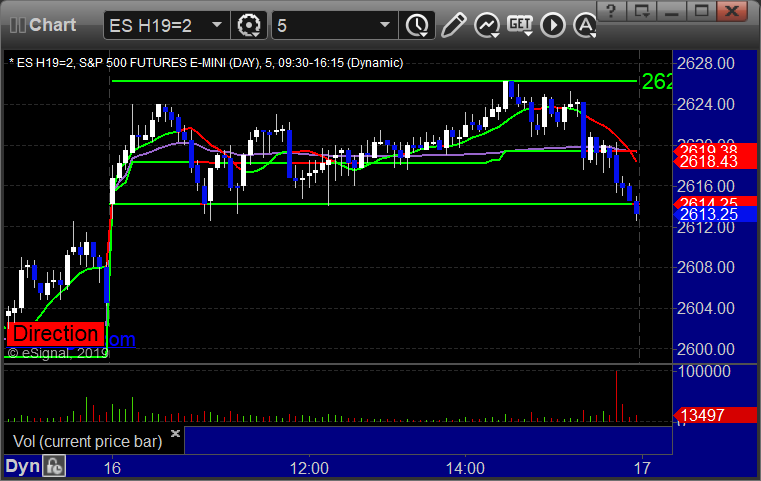
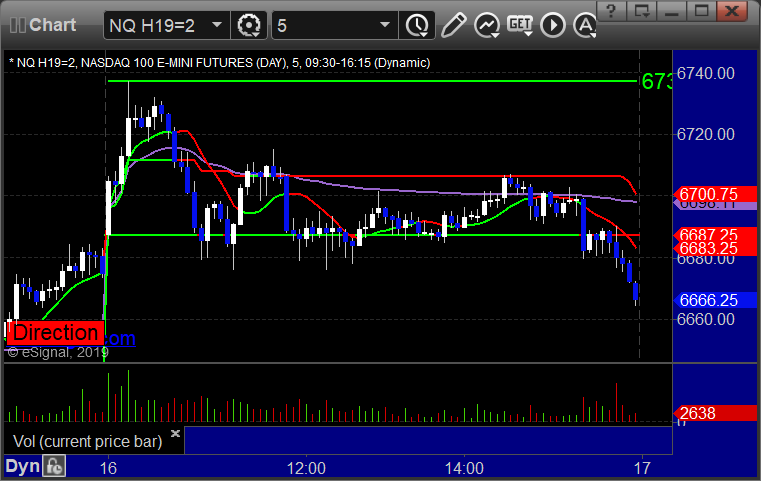
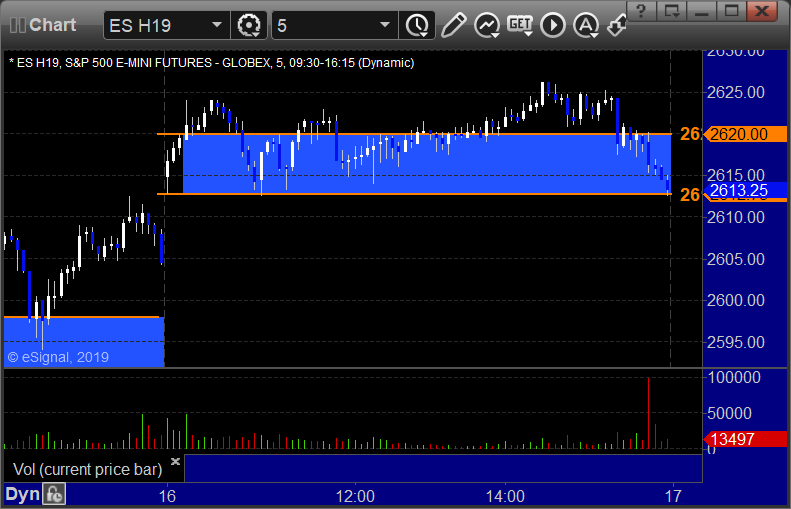
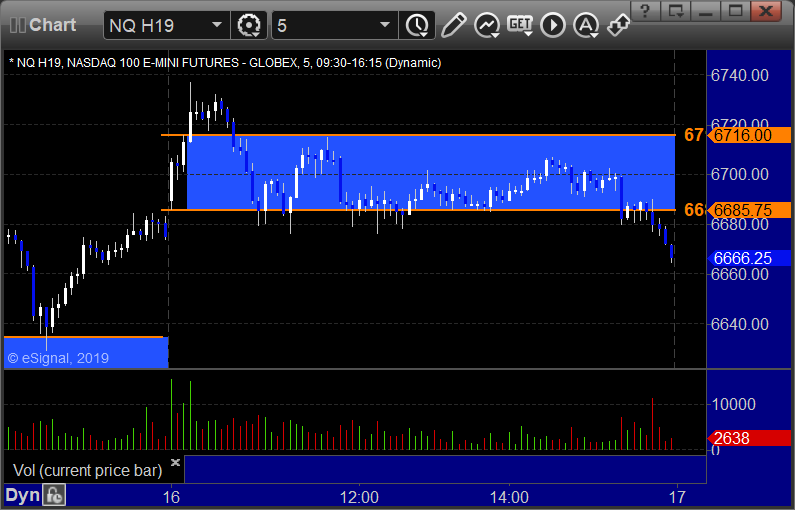
As usual, let’s start by taking a look at the ES and NQ with our
market directional lines, VWAP, and Comber on the 5-minute chart from
today’s session:
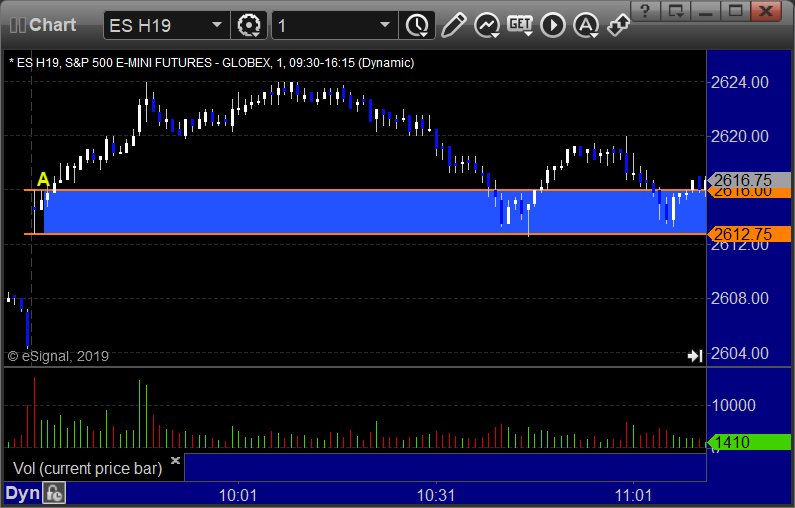
ES and NQ Opening and Institutional Range Plays:
ES Opening Range Play triggered long at A and worked:
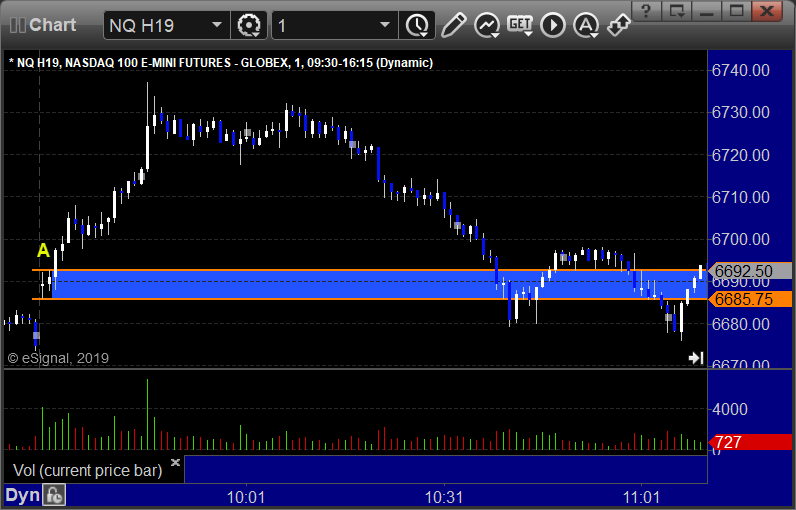
NQ Opening Range Play triggered long at A and worked:
ES Tradesight Institutional Range Play:
NQ Tradesight Institutional Range Play:
ES: