The markets gapped down, went lower most of the day, and tried to bounce in the last hour on 2.4 billion NASDAQ shares.
Net ticks: -11 ticks.
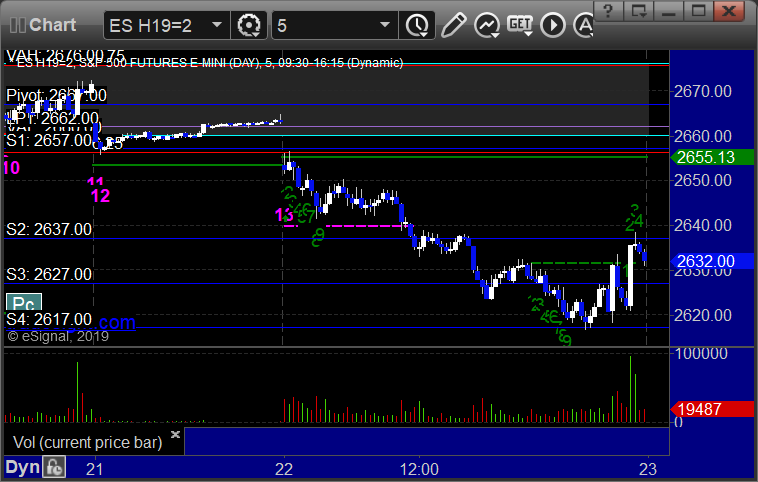
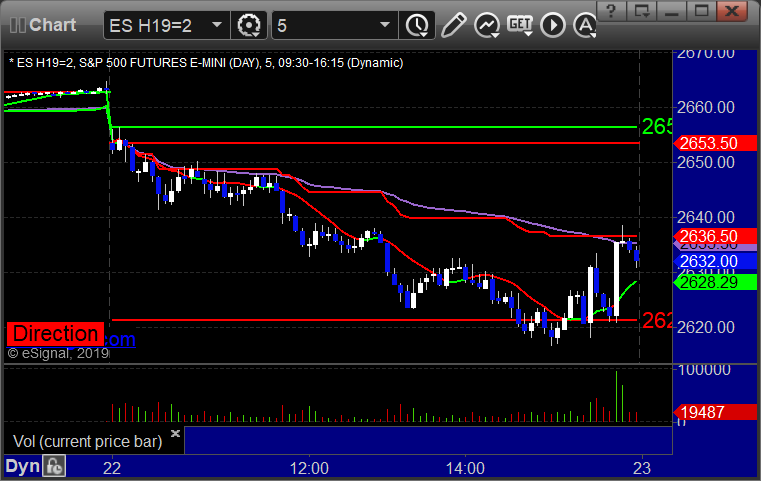
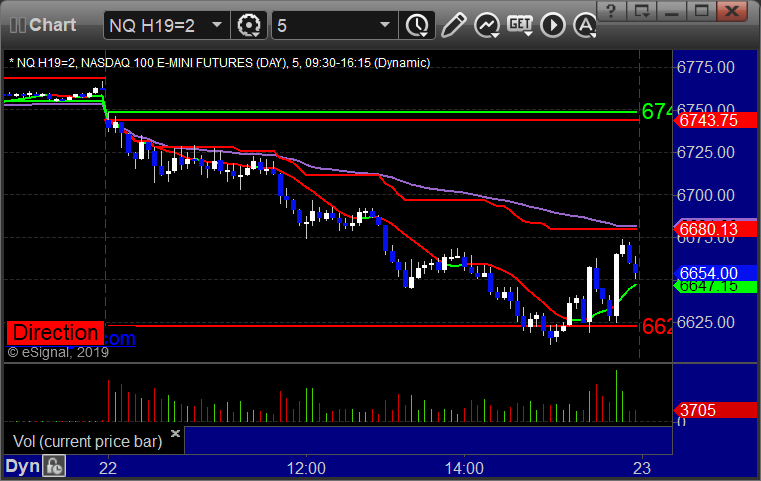
As usual, let’s start by taking a look at the ES and NQ with our
market directional lines, VWAP, and Comber on the 5-minute chart from
today’s session:
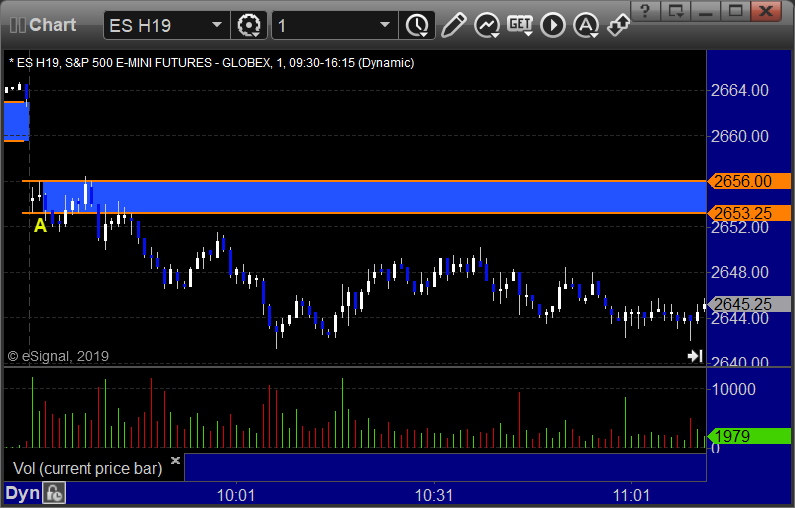
ES and NQ Opening and Institutional Range Plays:
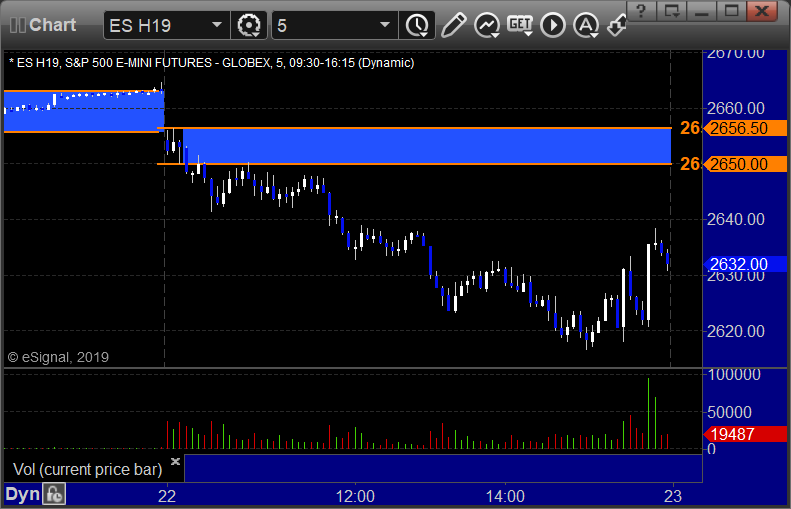
ES Opening Range Play triggered short at A and stopped:
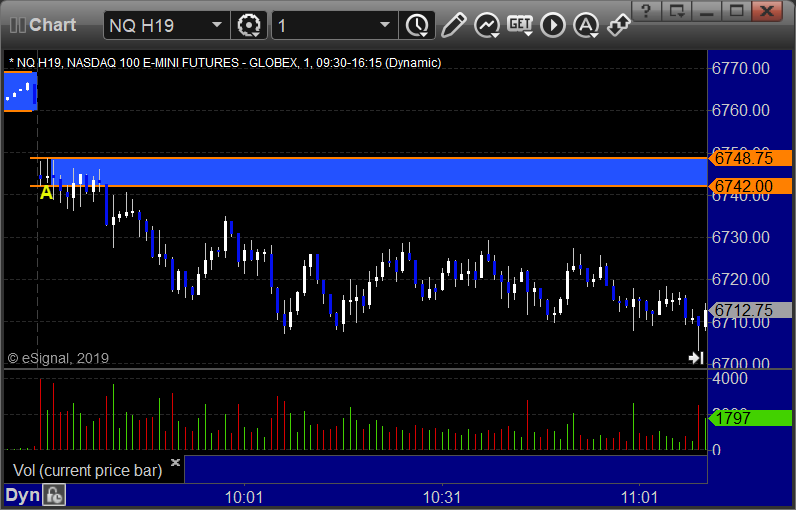
NQ Opening Range Play triggered short at A and worked enough for a partial:
ES Tradesight Institutional Range Play:
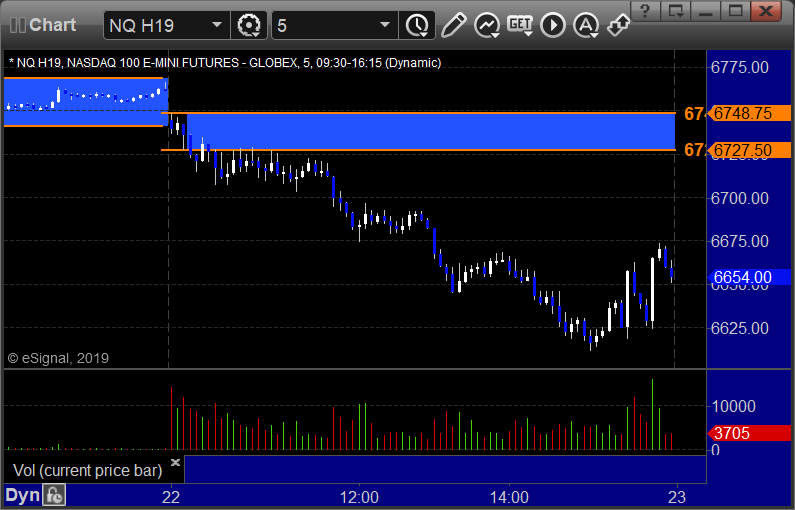
NQ Tradesight Institutional Range Play:
ES: