The markets gapped down
and closed where they opened, although they did try to go lower. They
never could try higher successfully. NASDAQ volume was 2.4 billion
shares.
Net ticks: +23 ticks.
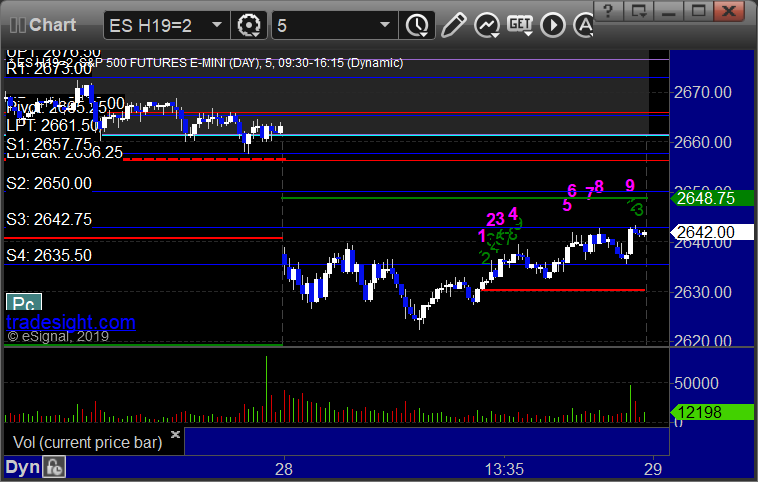
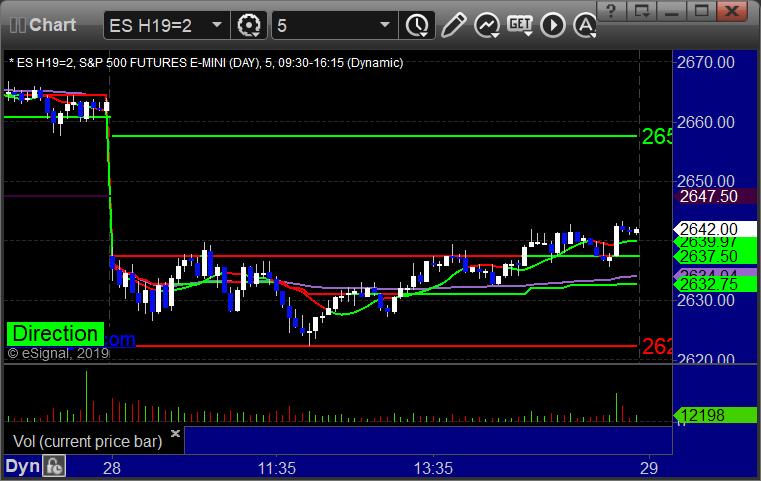
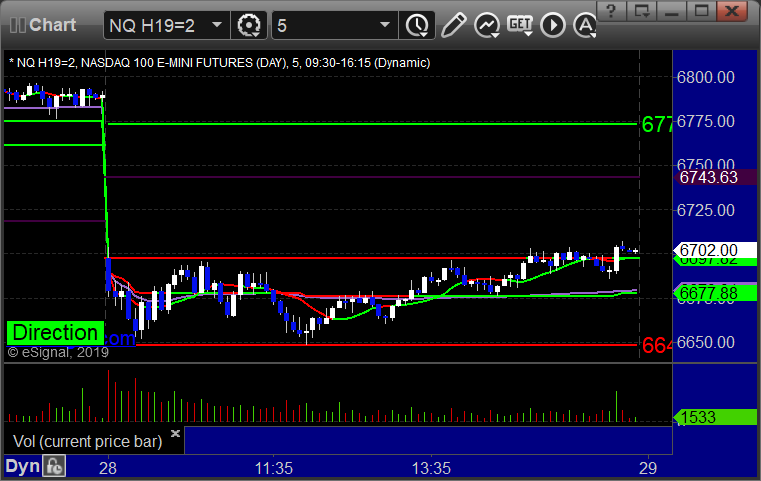
As usual, let’s start by taking a look at the ES and NQ with our
market directional lines, VWAP, and Comber on the 5-minute chart from
today’s session:
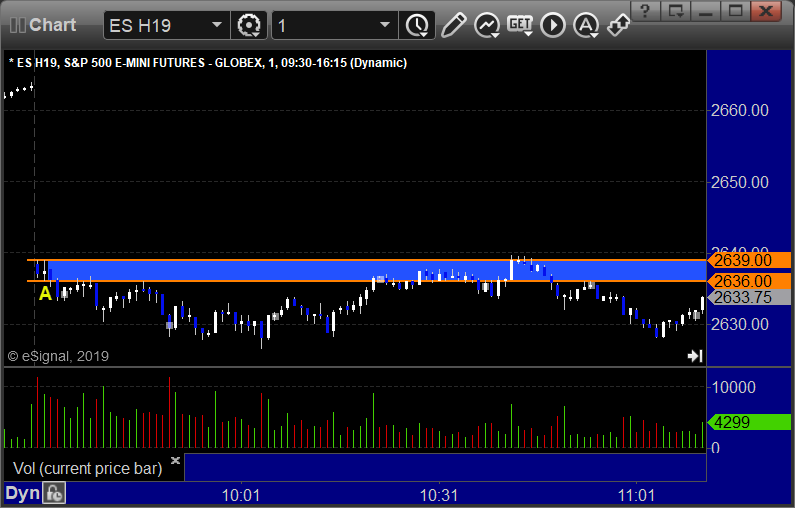
ES and NQ Opening and Institutional Range Plays:
ES Opening Range Play triggered short at A and worked enough for a partial:
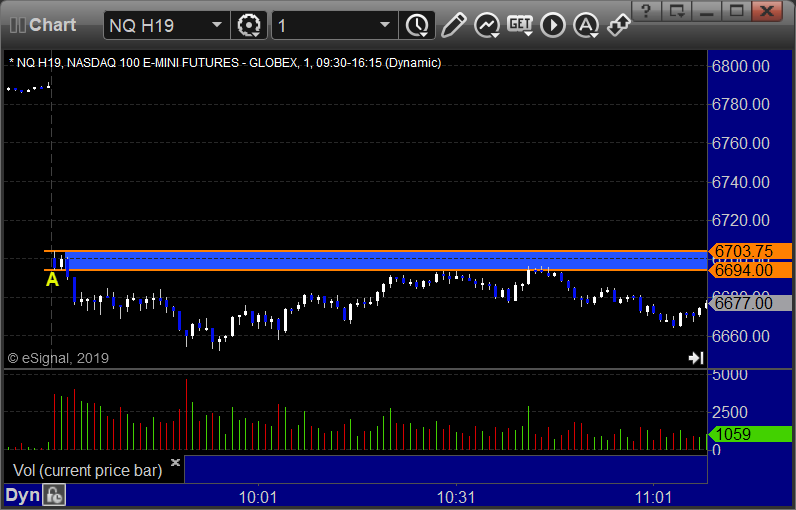
NQ Opening Range Play triggered short at A and worked:
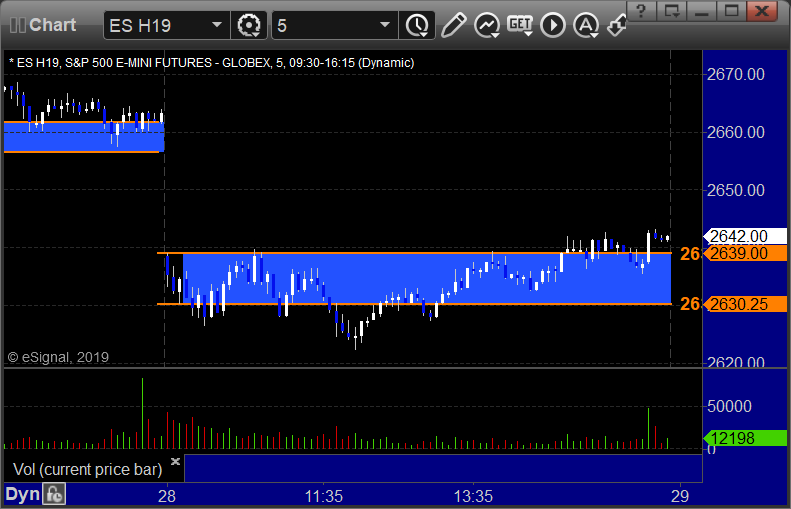
ES Tradesight Institutional Range Play:
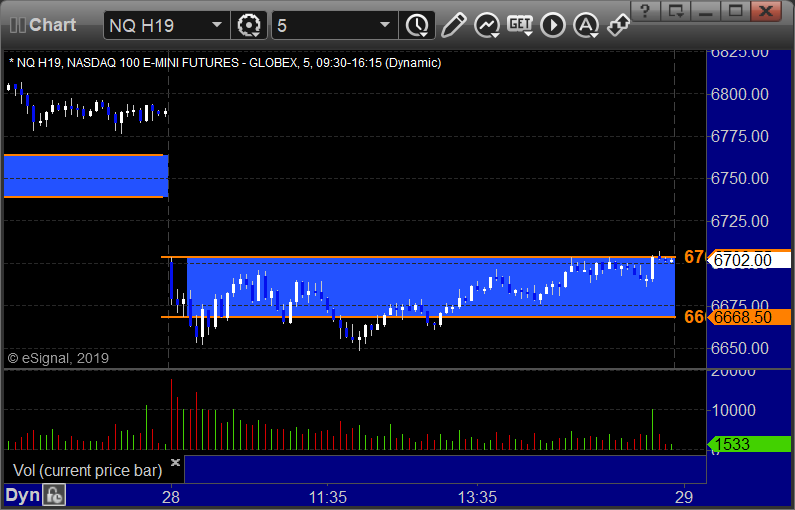
NQ Tradesight Institutional Range Play:
ES: