The markets gapped down, went lower, recovered a bit, then closed at lows on 2.5 billion NASDAQ shares after the AAPL warning.
Net ticks: +11 ticks.
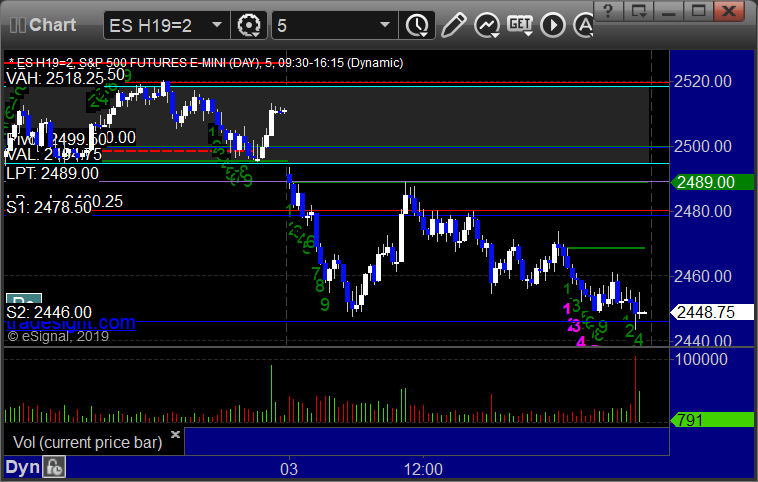
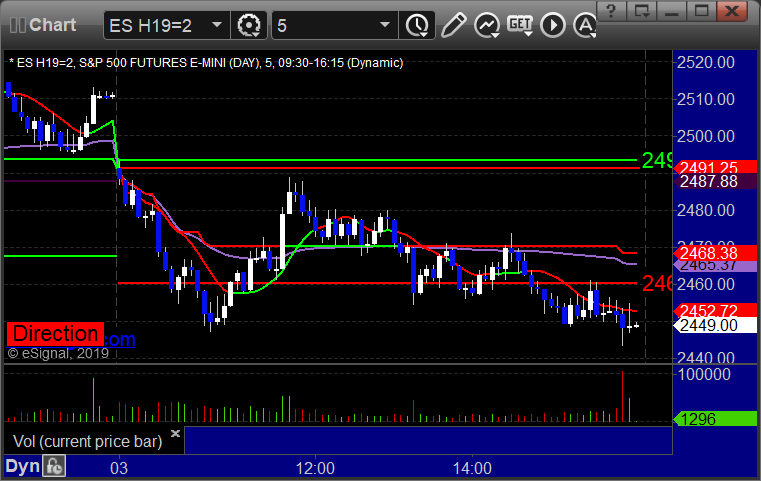
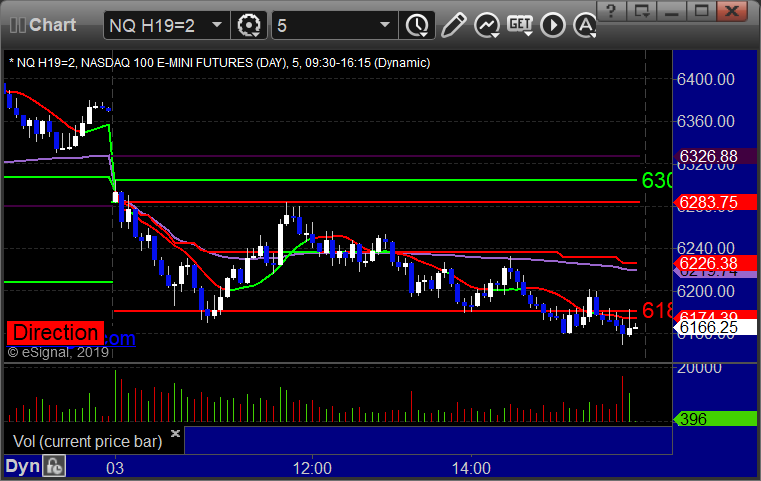
As usual, let’s start by taking a look at the ES and NQ with our market directional lines, VWAP, and Comber on the 5-minute chart from today’s session:
ES and NQ Opening and Institutional Range Plays:
ES Opening Range Play triggered short at A and worked:
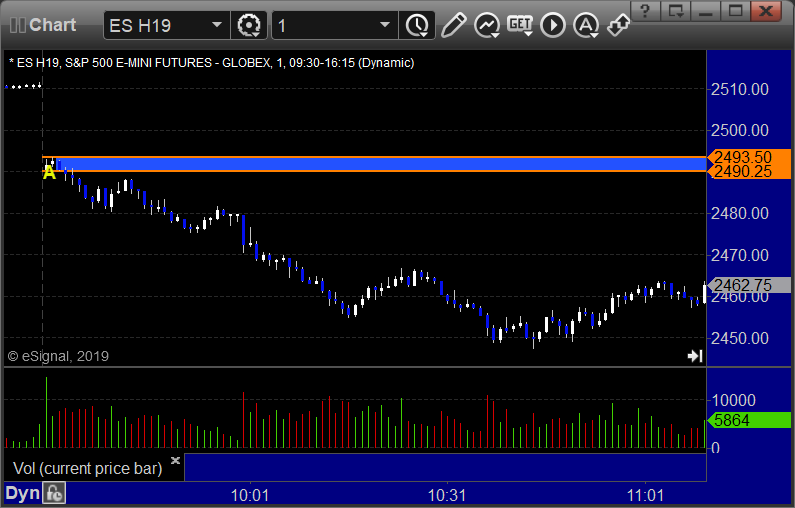
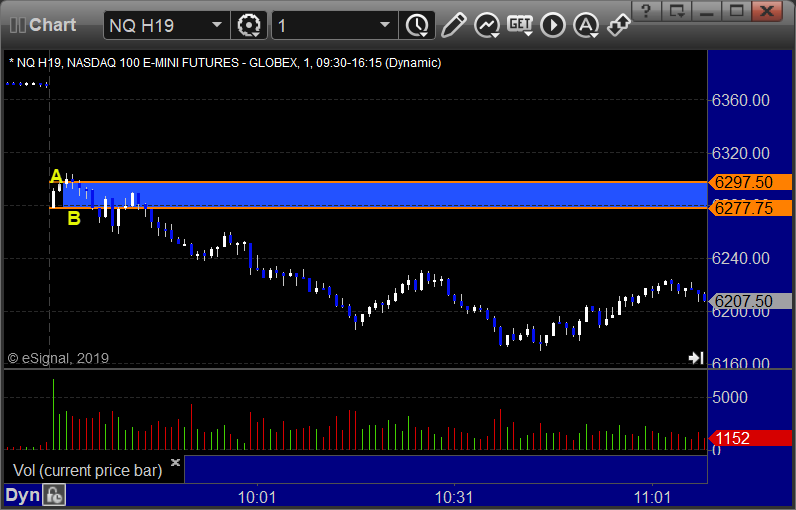
NQ Opening Range Play triggered long at A and short at B but both too much risk to take:
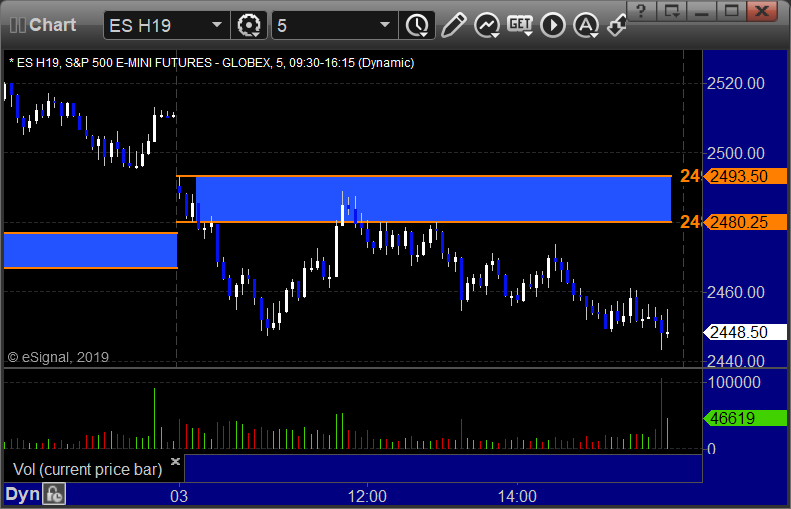
ES Tradesight Institutional Range Play:
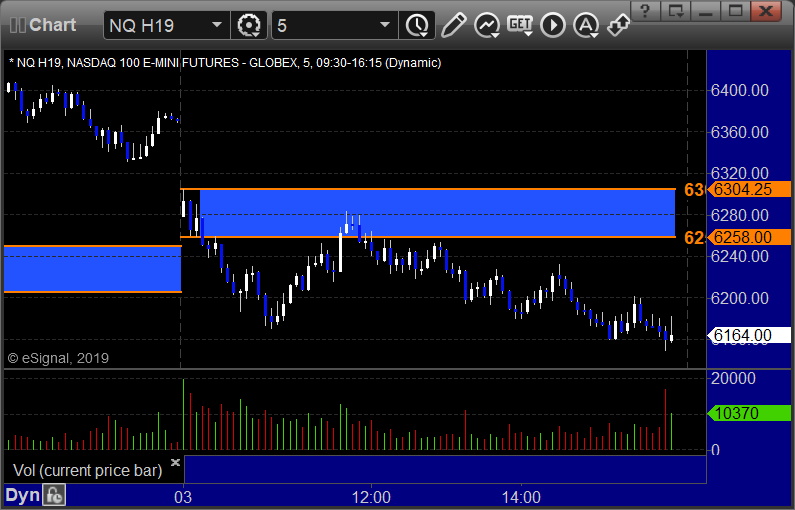
NQ Tradesight Institutional Range Play:
ES: