The markets gapped down small and filled and sat mostly flat on 2.6 billion NASDAQ shares.
Net ticks: +0 ticks.
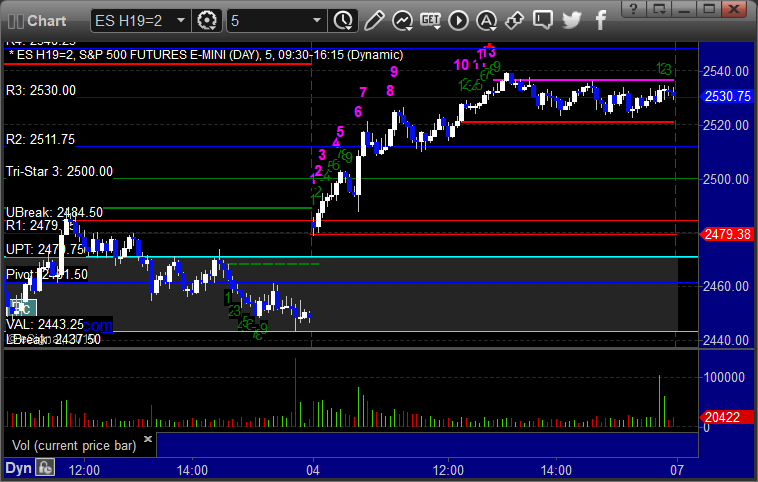
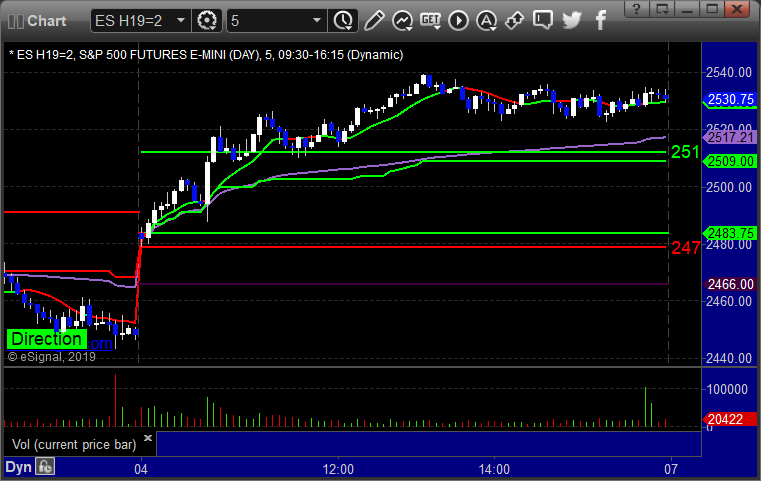
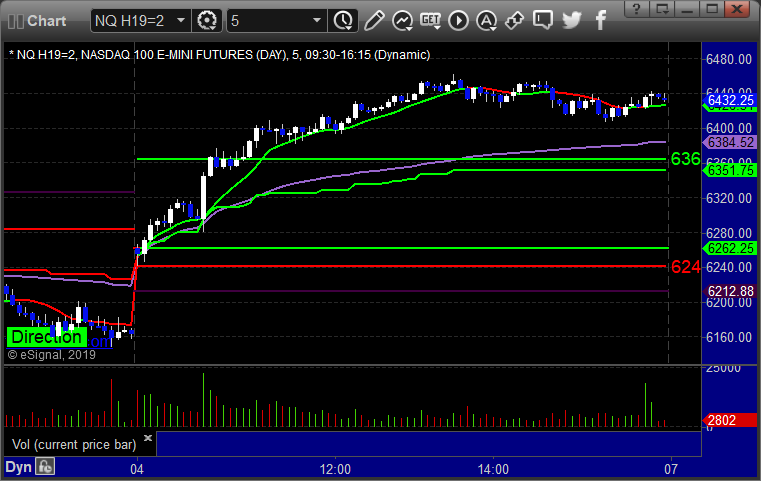
As usual, let’s start by taking a look at the ES and NQ with our market directional lines, VWAP, and Comber on the 5-minute chart from today’s session:
ES and NQ Opening and Institutional Range Plays:
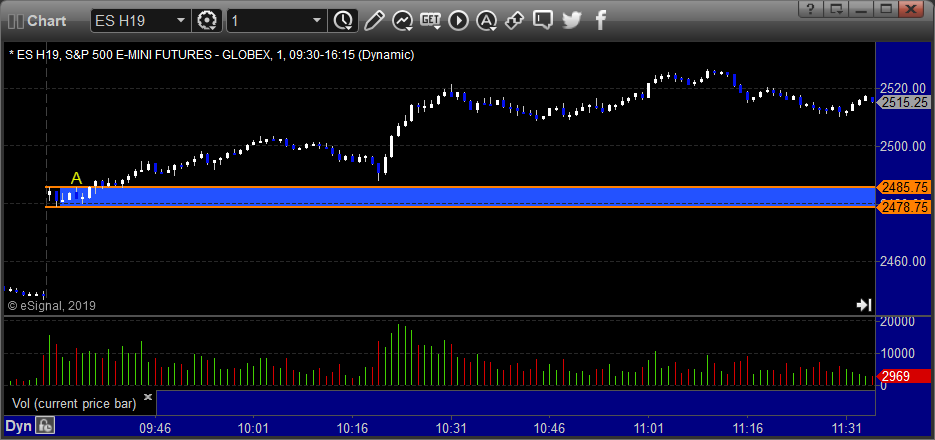
ES Opening Range Play triggered long at A but too far out of range to take:
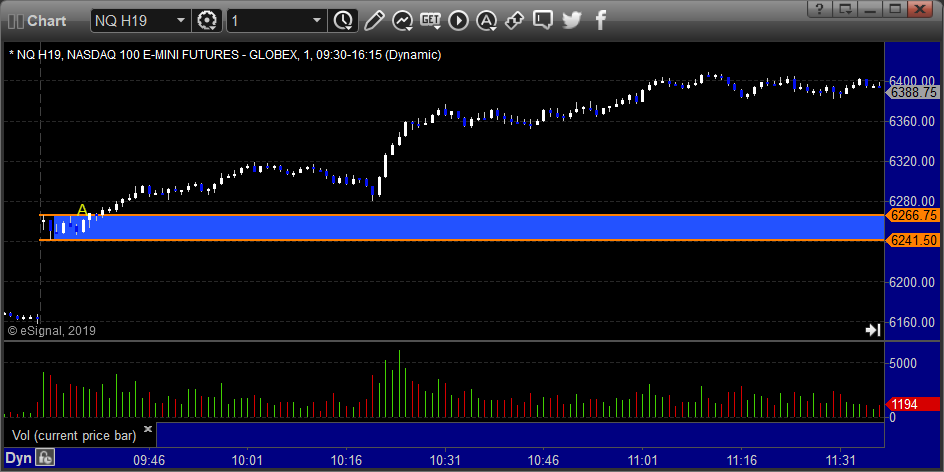
NQ Opening Range Play triggered long at A but too far out of range to take, same with the short at B:
ES Tradesight Institutional Range Play:
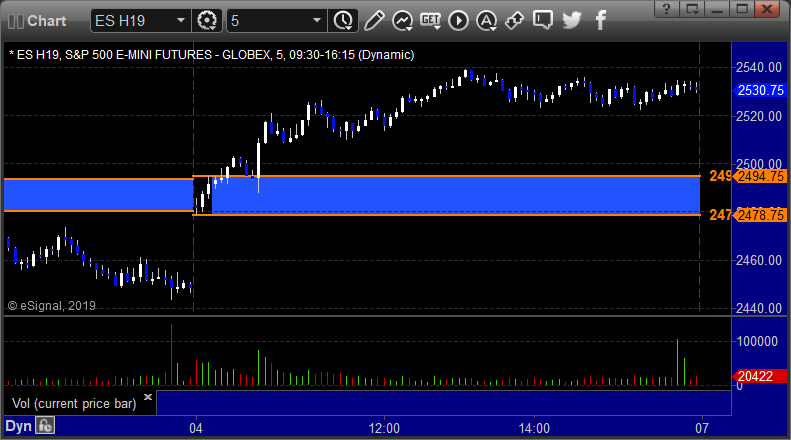
NQ Tradesight Institutional Range Play:
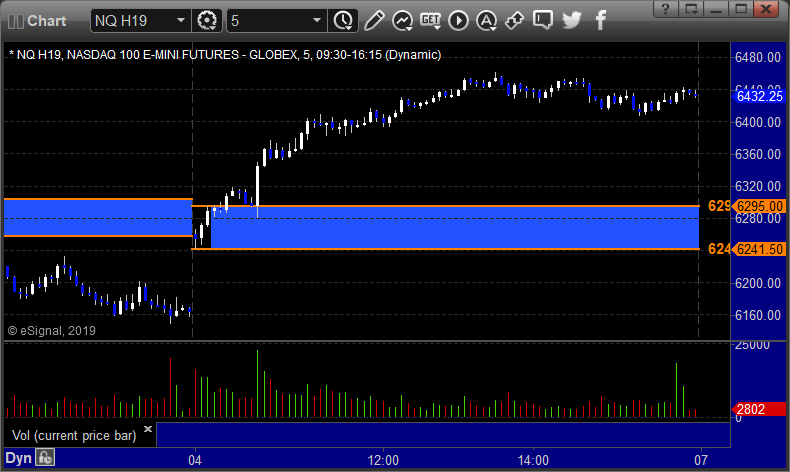
ES: