The markets gapped down,
went lower briefly, and then headed back up, filled the gap, and closed
slightly positive on a weak 2.1 billion NASDAQ shares.
Net ticks: +4 ticks.
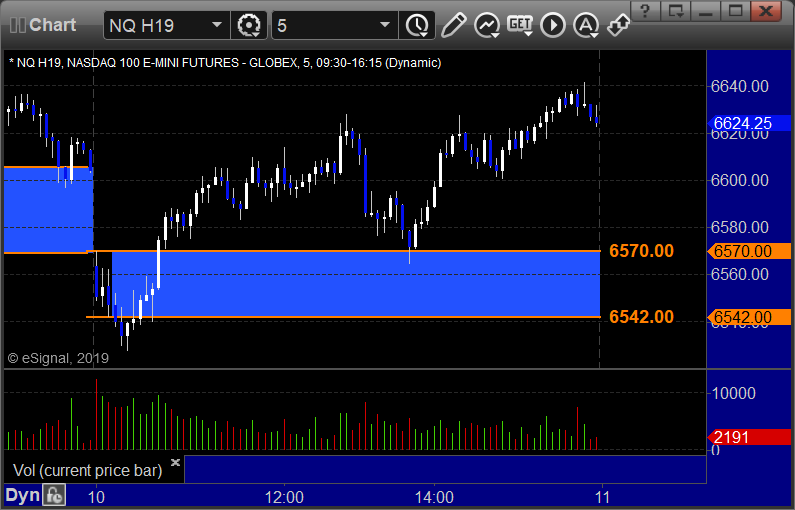
As usual, let’s start by taking a look at the ES and NQ with our
market directional lines, VWAP, and Comber on the 5-minute chart from
today’s session:
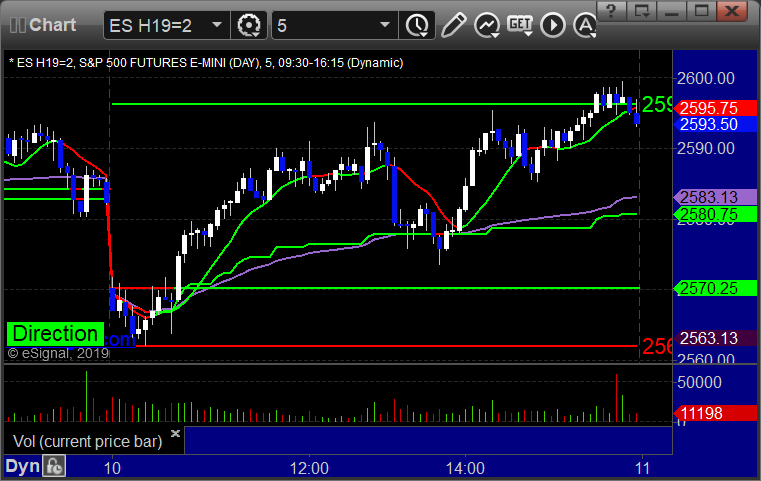
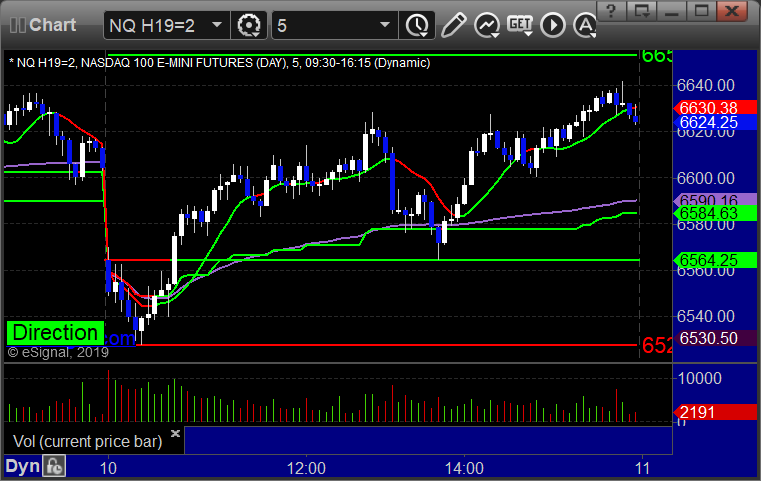
ES and NQ Opening and Institutional Range Plays:
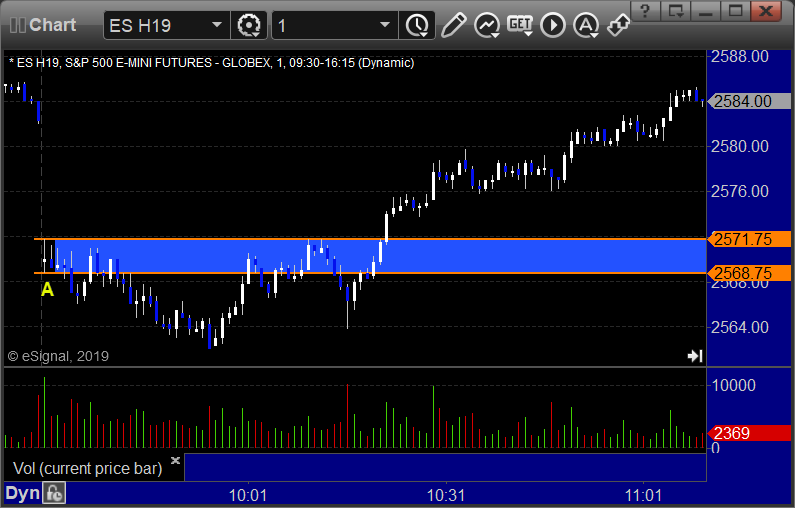
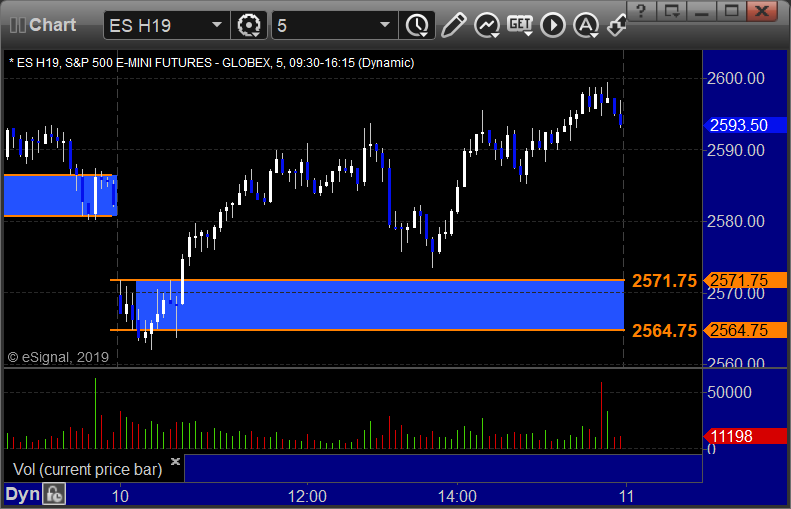
ES Opening Range Play triggered short at A and worked:
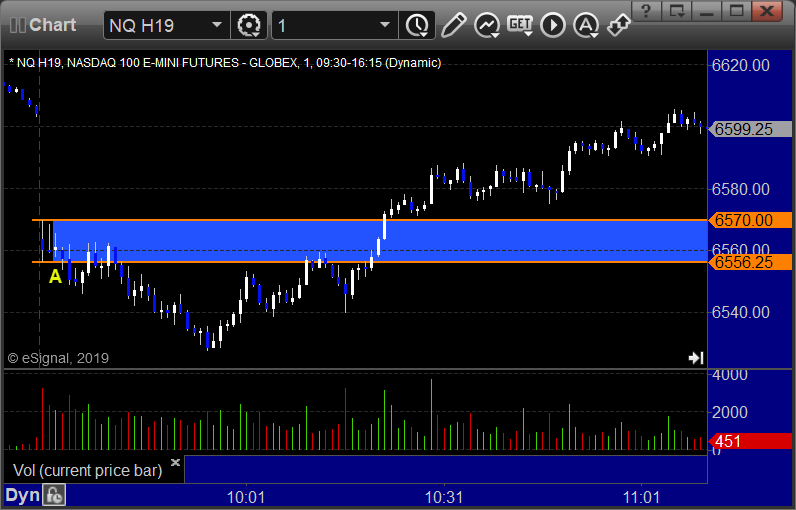
NQ Opening Range Play:
ES Tradesight Institutional Range Play:
NQ Tradesight Institutional Range Play:
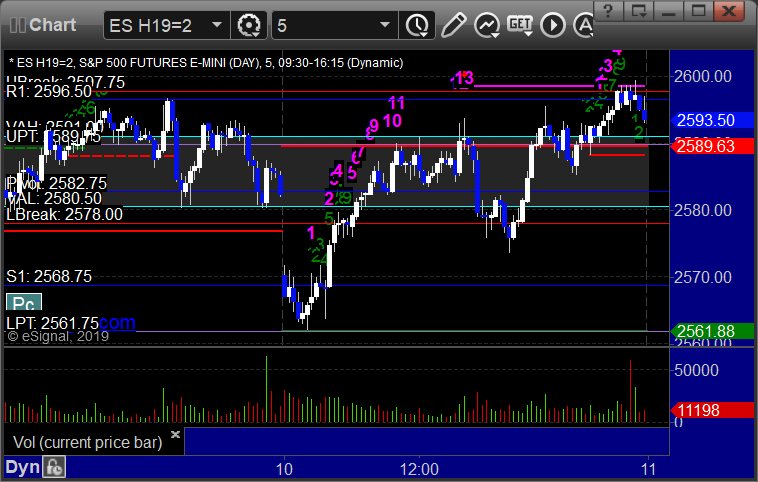
ES: