The markets gapped mixed, drifted lower early, went flat for over half of the day, then dipped coming out of lunch and popped back up to the midpoint/VWAP area on 3.5 billion NASDAQ shares.
Net ticks: +4 ticks.
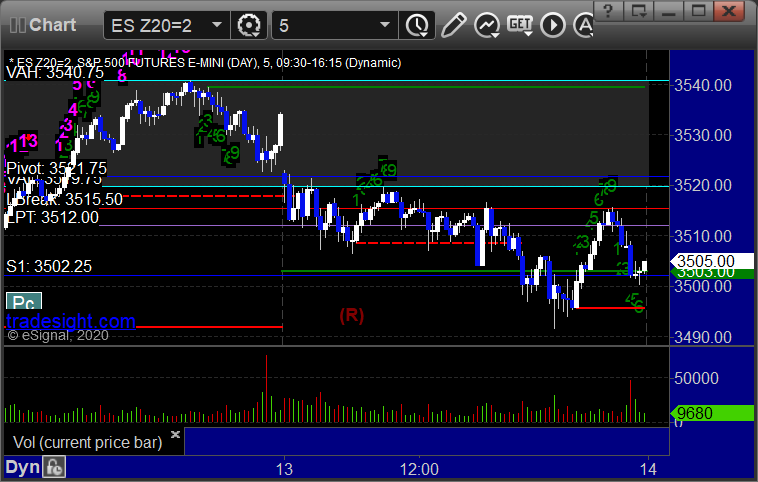
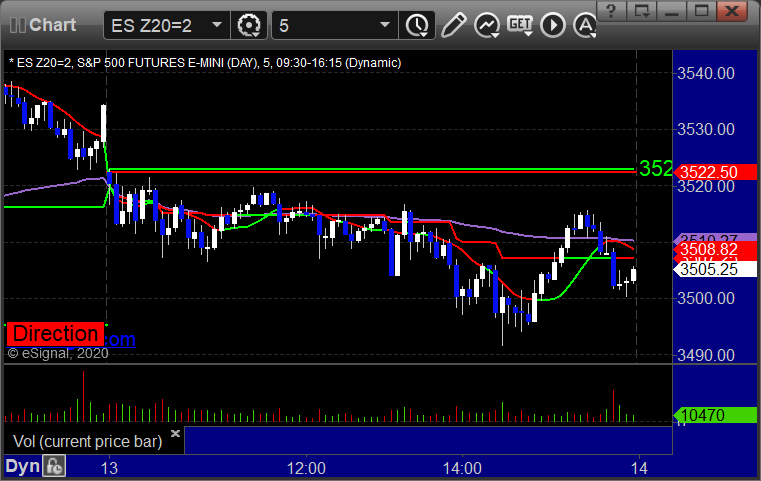
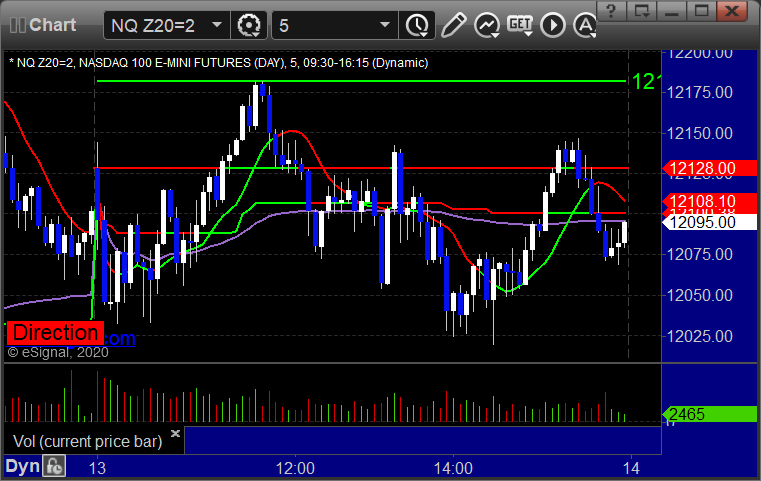
As usual, let’s start by taking a look at the ES and NQ with our market directional lines, VWAP, and Comber on the 5-minute chart from today’s session:
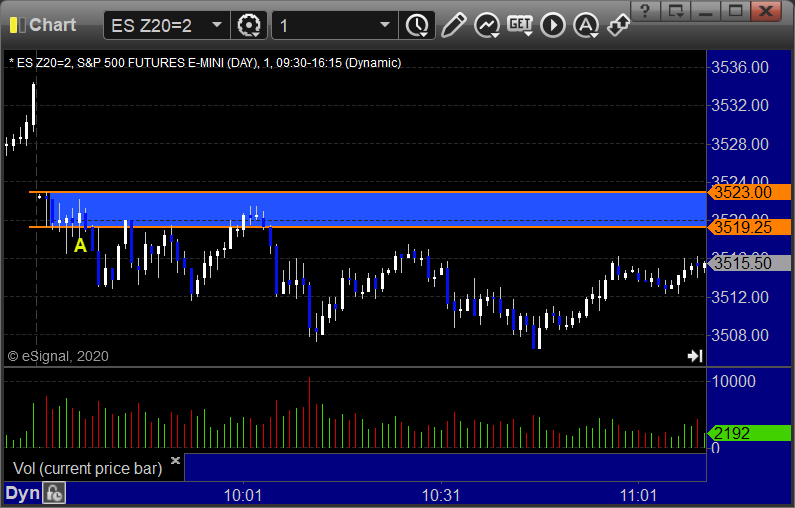
ES and NQ Opening and Institutional Range Plays:
ES Opening Range Play triggered short at A and worked enough for a partial:
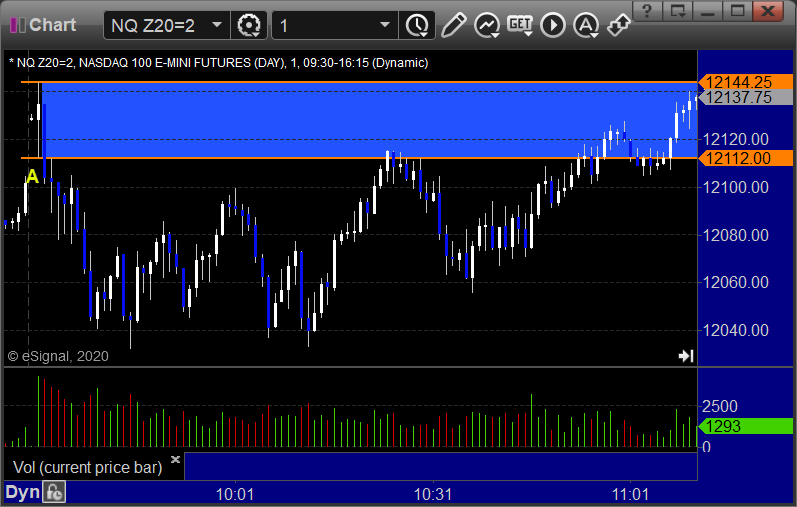
NQ Opening Range Play triggered short at A but too far out of range to take:
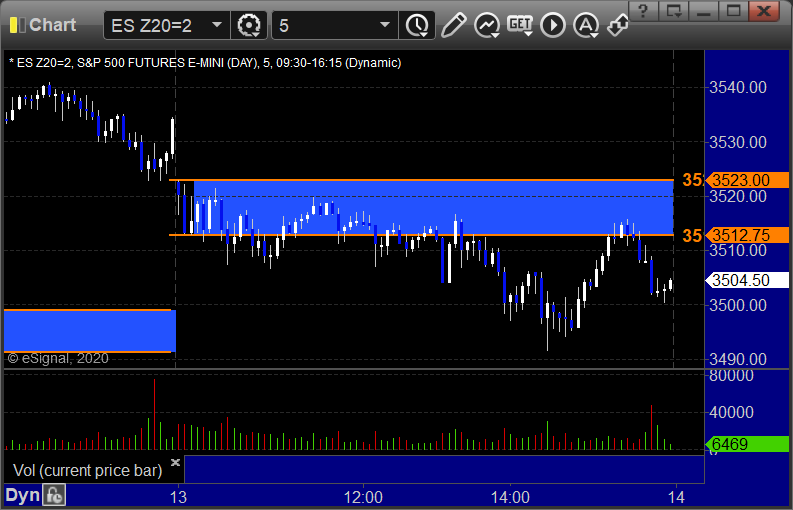
ES Tradesight Institutional Range Play:
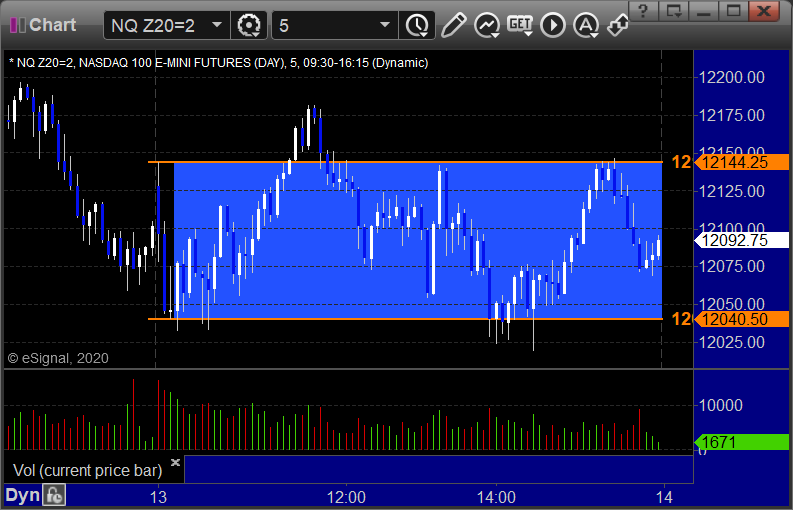
NQ Tradesight Institutional Range Play:
ES: