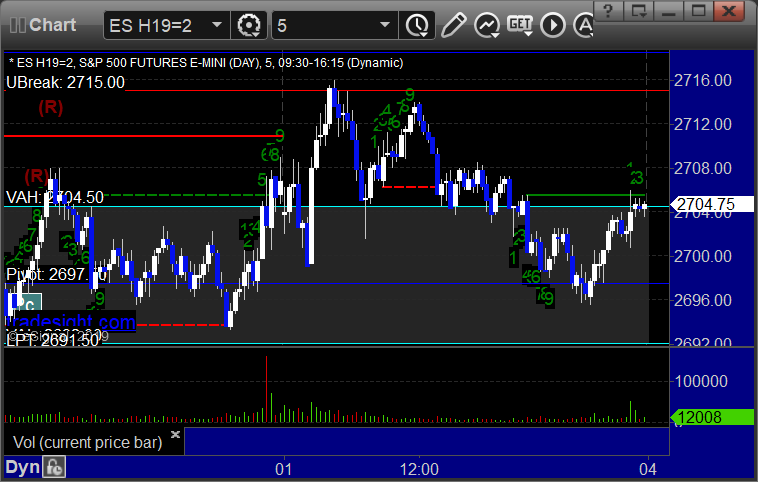
The markets were mixed early, then went higher, then drifted down to the close on 2.3 billion NASDAQ shares.
Net ticks: -7 ticks.
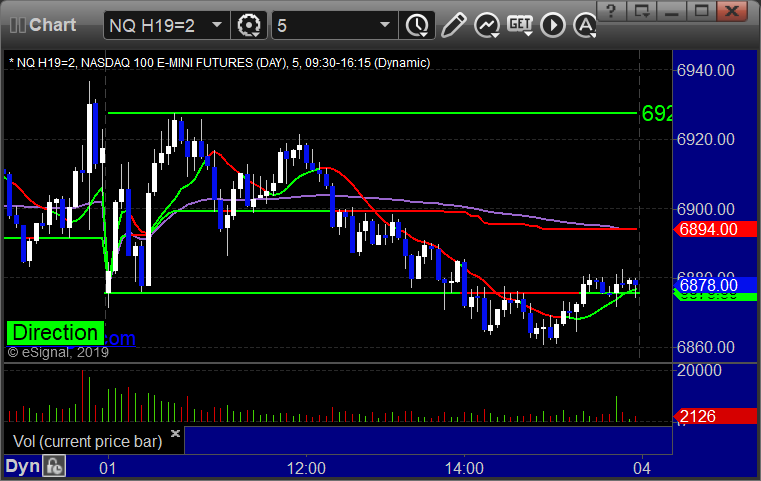
As usual, let’s start by taking a look at the ES and NQ with our
market directional lines, VWAP, and Comber on the 5-minute chart from
today’s session:

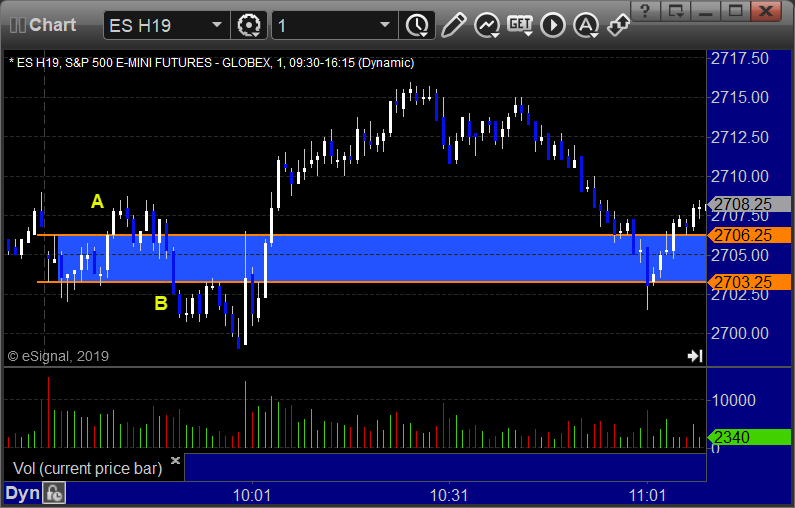
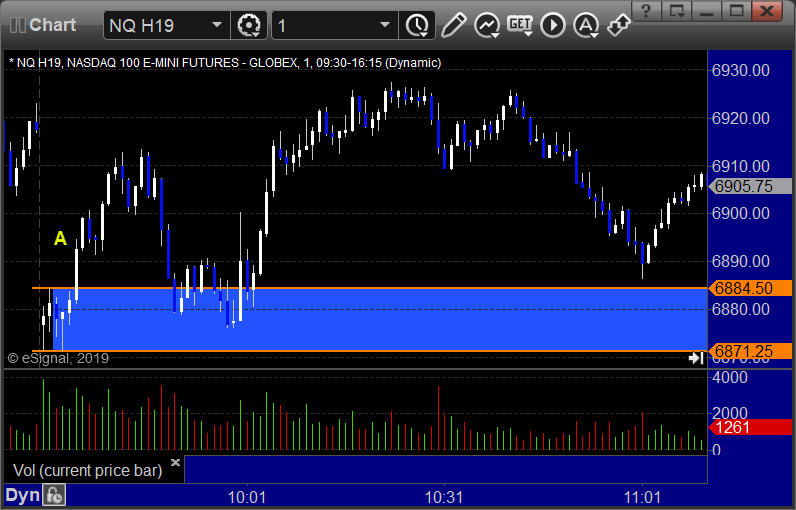
ES and NQ Opening and Institutional Range PLays:
ES Opening Range Play triggered long at A and stopped under the midpoint, triggered short at B and worked enough for a partial:
NQ Opening Range Play triggered long but way too far outside the OR to take:
ES Tradesight Institutional Range Play:

NQ Tradesight Institutional Range Play:

ES: