The markets gapped up
and drifted all day, basically just down enough to fill. ES traded about
25% of normal range on a very weak 1.8 billion NASDAQ shares.
Net ticks: -29 ticks.
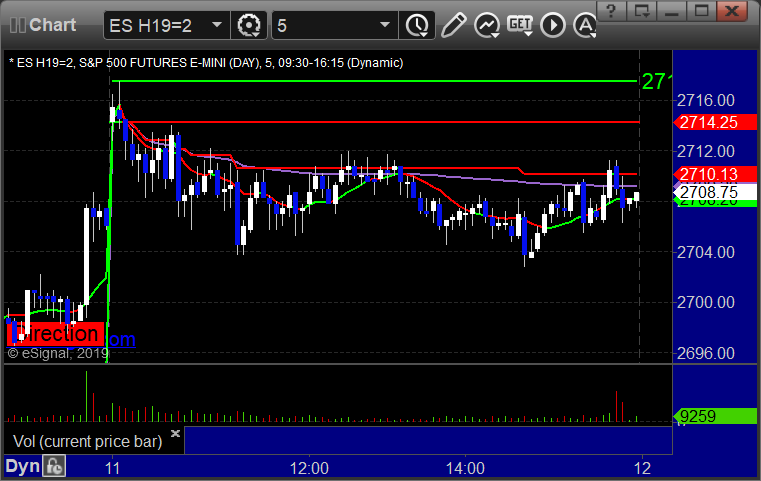
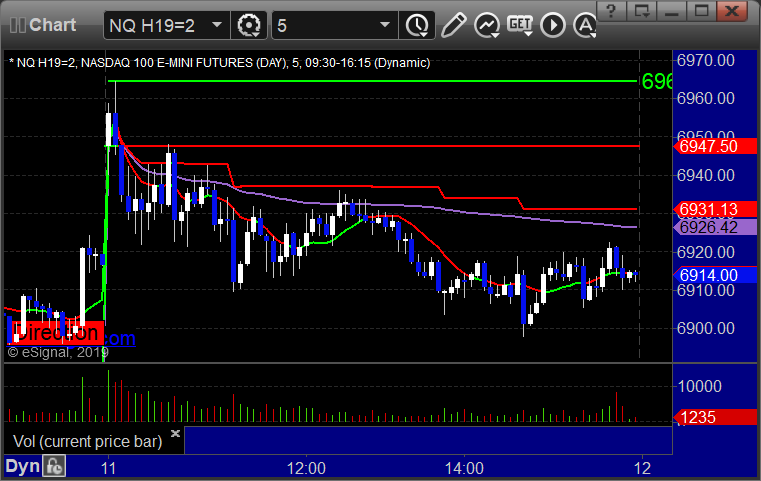
As usual, let’s start by taking a look at the ES and NQ with our
market directional lines, VWAP, and Comber on the 5-minute chart from
today’s session:
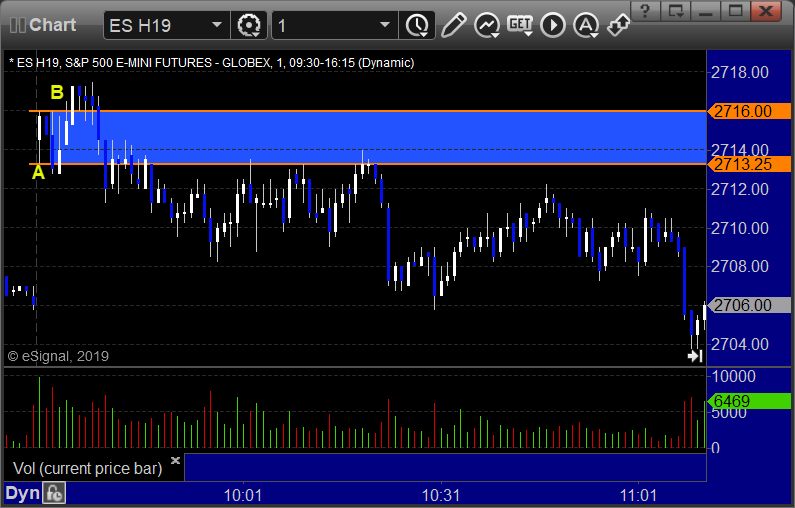
ES and NQ Opening and Institutional Range Plays:
ES Opening Range Play triggered short at A and stopped, triggered long at B and stopped:
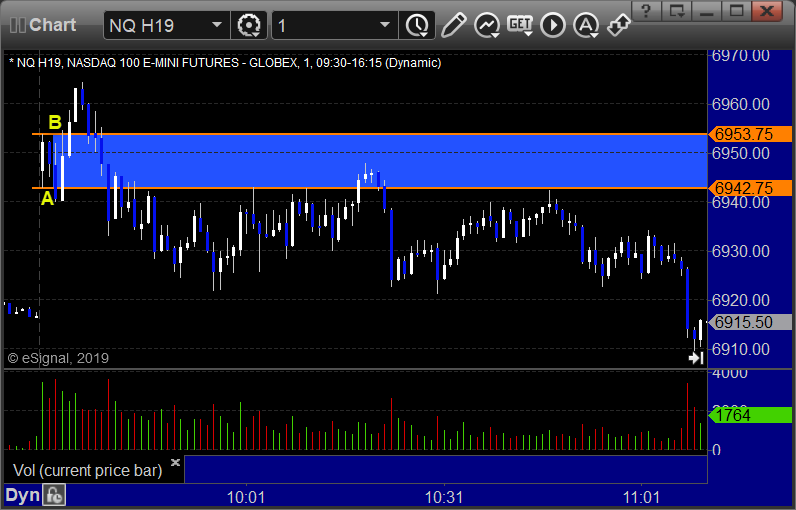
NQ Opening Range Play triggered short at A and stopped, triggered long at B and worked enough for a partial:
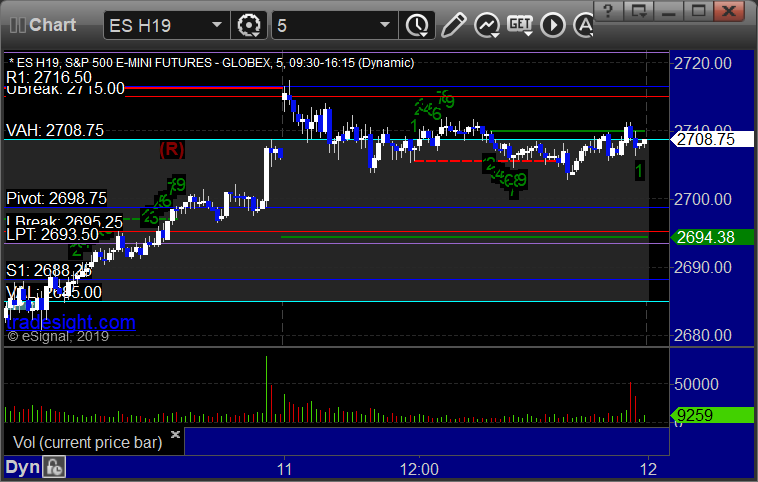
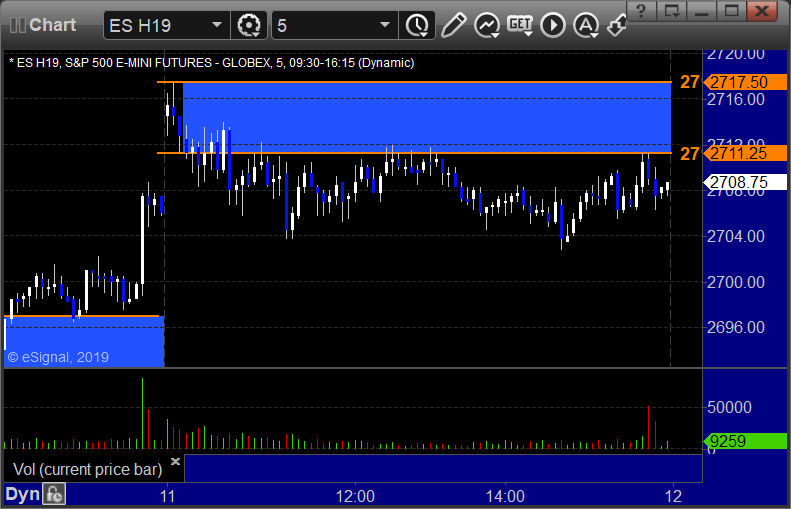
ES Tradesight Institutional Range Play:
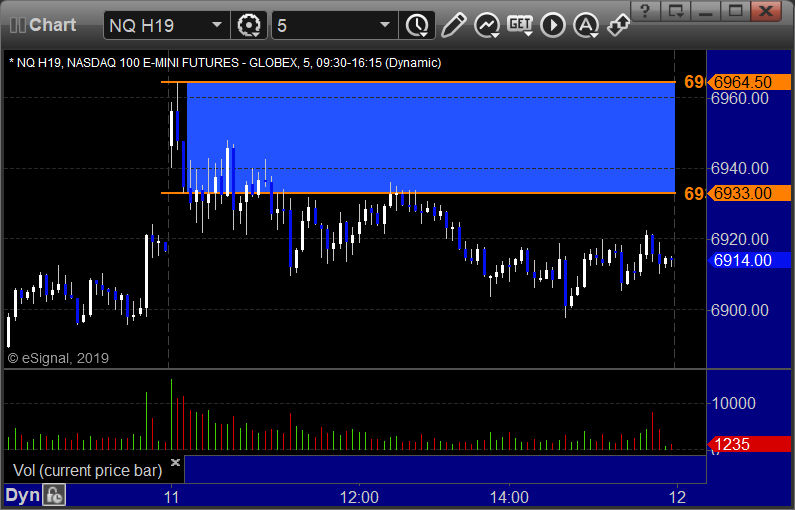
NQ Tradesight Institutional Range Play:
ES: