The markets gapped up a little, filled quickly, and did nothing all day on 2.2 billion NASDAQ shares.
Net ticks: -20 ticks.
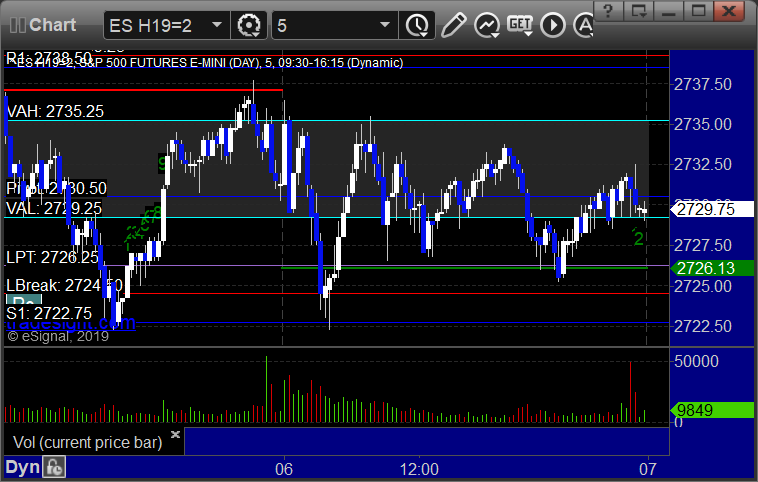
As usual, let’s start by taking a look at the ES and NQ with our
market directional lines, VWAP, and Comber on the 5-minute chart from
today’s session:
ES and NQ Opening and Institutional Range Plays:
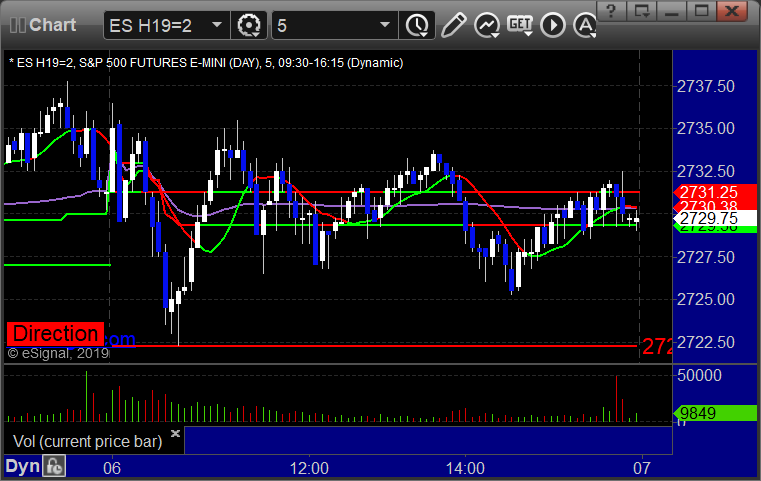
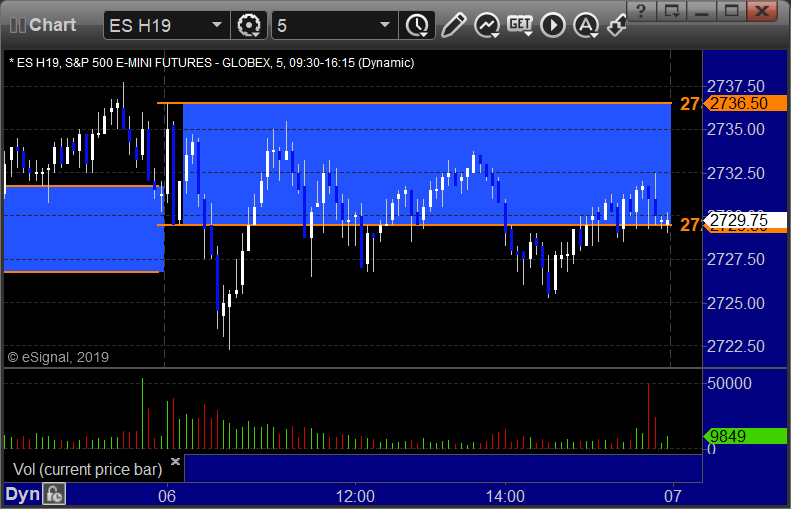
ES Opening Range Play triggered long at A and stopped under the midpoint, triggered short at B and stopped over the midpoint:
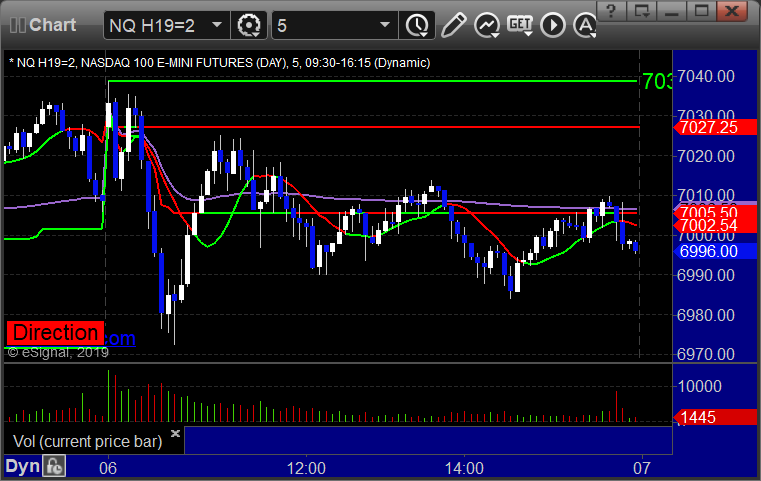
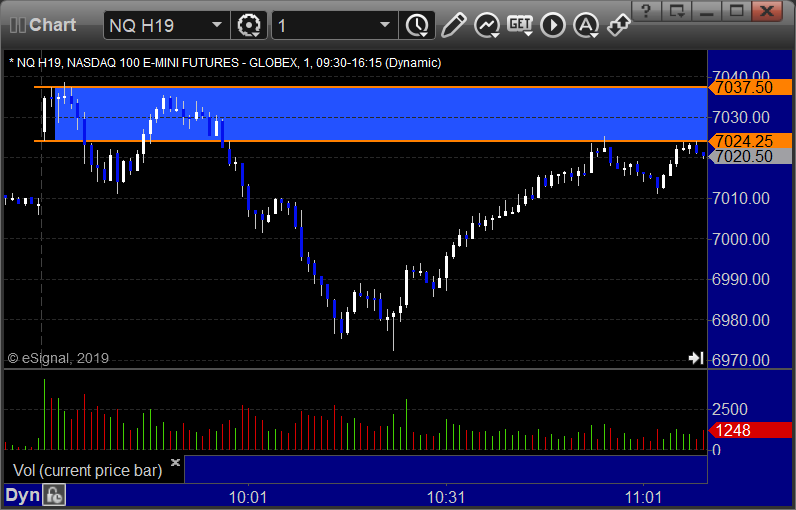
NQ Opening Range Play triggered short and worked enough for a partial:
ES Tradesight Institutional Range Play:
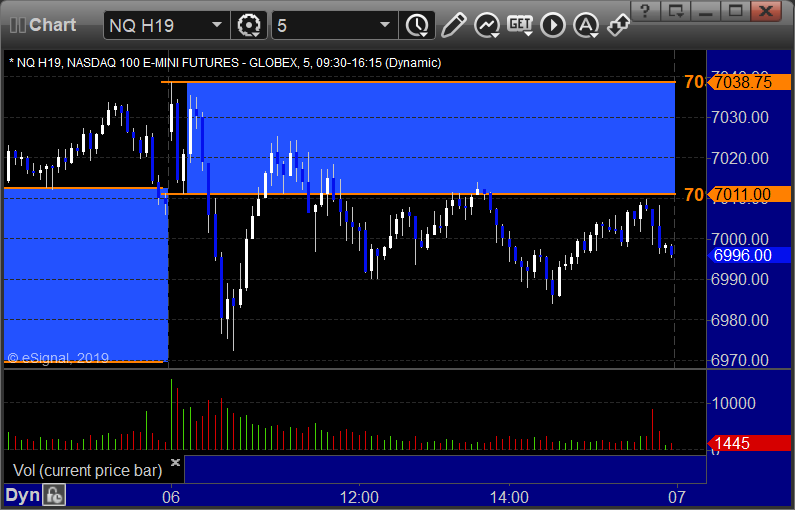
NQ Tradesight Institutional Range Play:
ES: