The markets gapped down,
try to go up, then went down and then flat and climbed after lunch to
fill the gap on 2.1 billion NASDAQ shares.
Net ticks: -24 ticks.
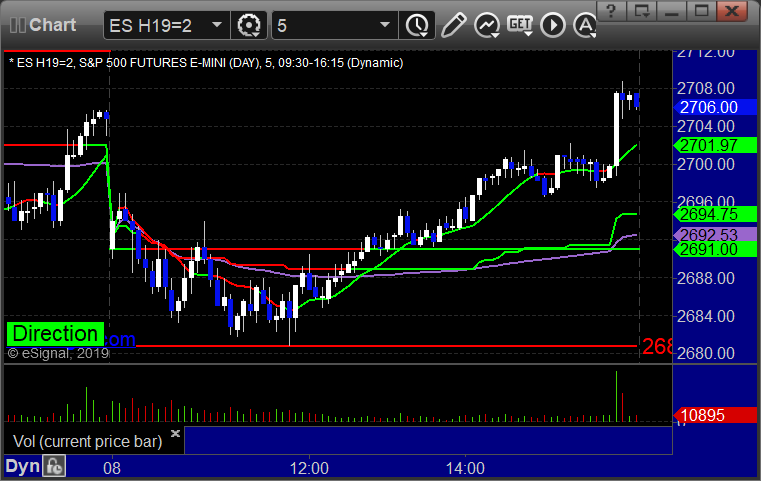
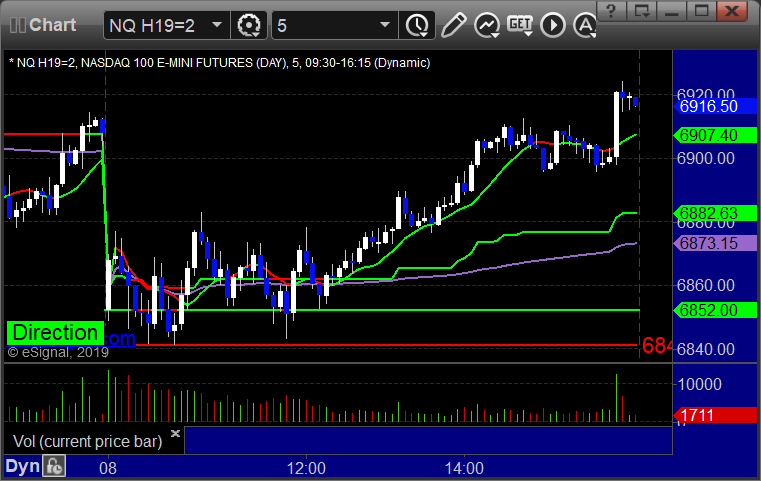
As usual, let’s start by taking a look at the ES and NQ with our
market directional lines, VWAP, and Comber on the 5-minute chart from
today’s session:
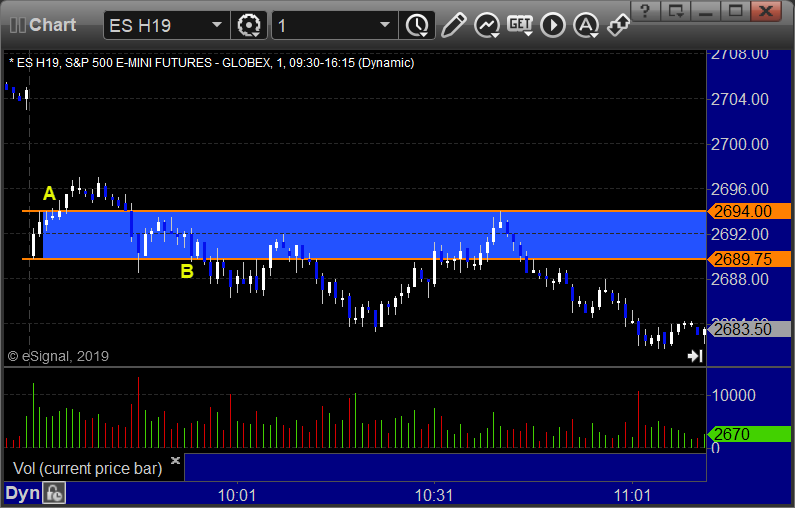
ES and NQ Opening and Institutional Range Plays:
ES Opening Range Play triggered long at A and stopped under the midpoint, triggered short at B and worked:
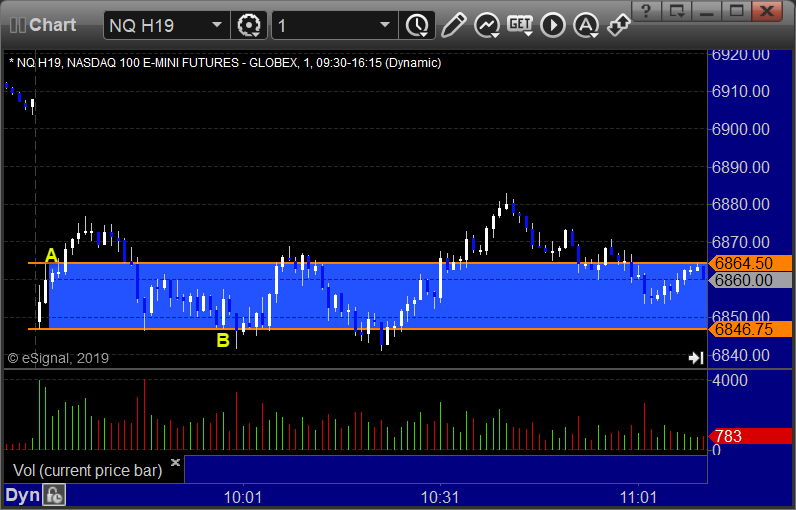
NQ Opening Range Play triggered long at A and worked, triggered short at B and stopped over the midpoint:
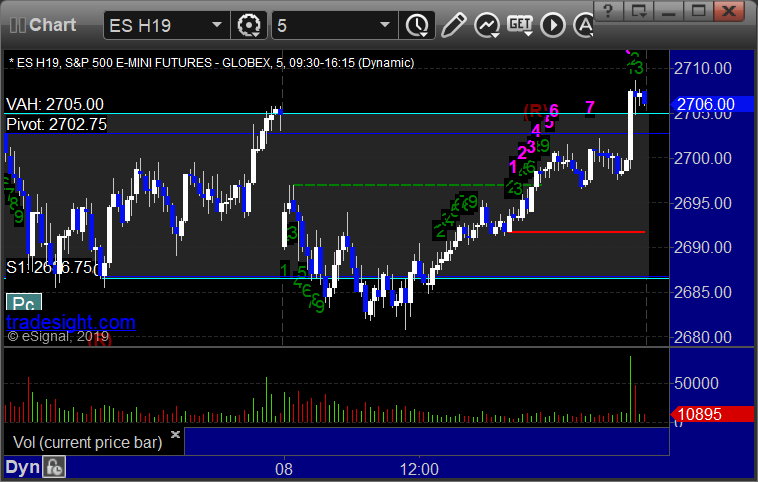
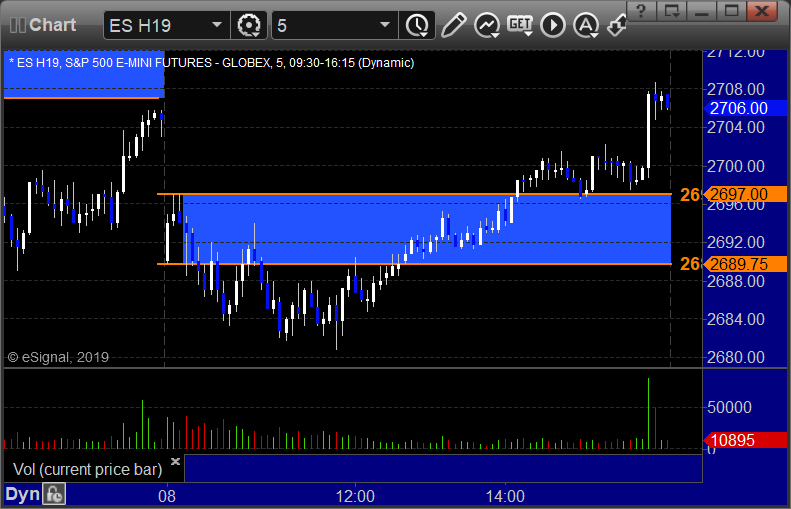
ES Tradesight Institutional Range Play:
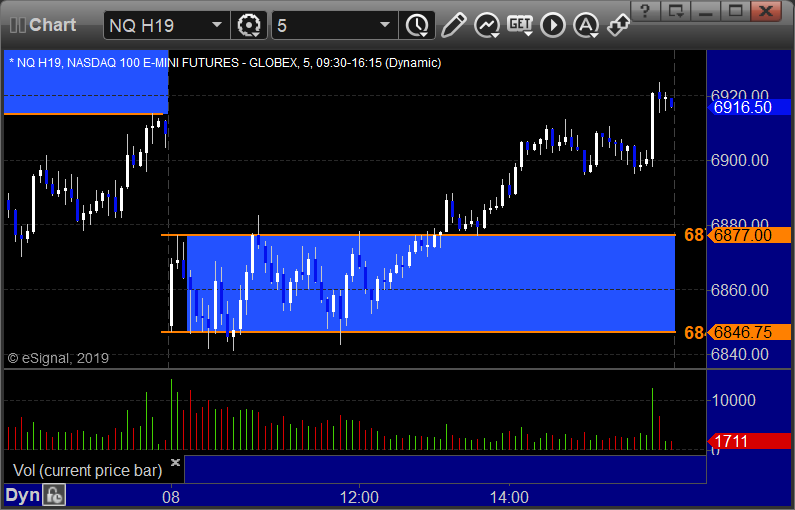
NQ Tradesight Institutional Range Play:
ES: